Creating Scenarios
To uncover answers to your business questions, you will first need to create a scenario. A scenario allows you to adapt any of our Use Cases for your specific needs, by specifying which data you want to use and how granular that data will be. This then allows you to append your selected data (from your Portfolio) with your chosen Use Case.
Once your scenario is filled out and created, it will reveal your Solution. You will then see it listed in your Solutions dashboard.
Creating a New Scenario
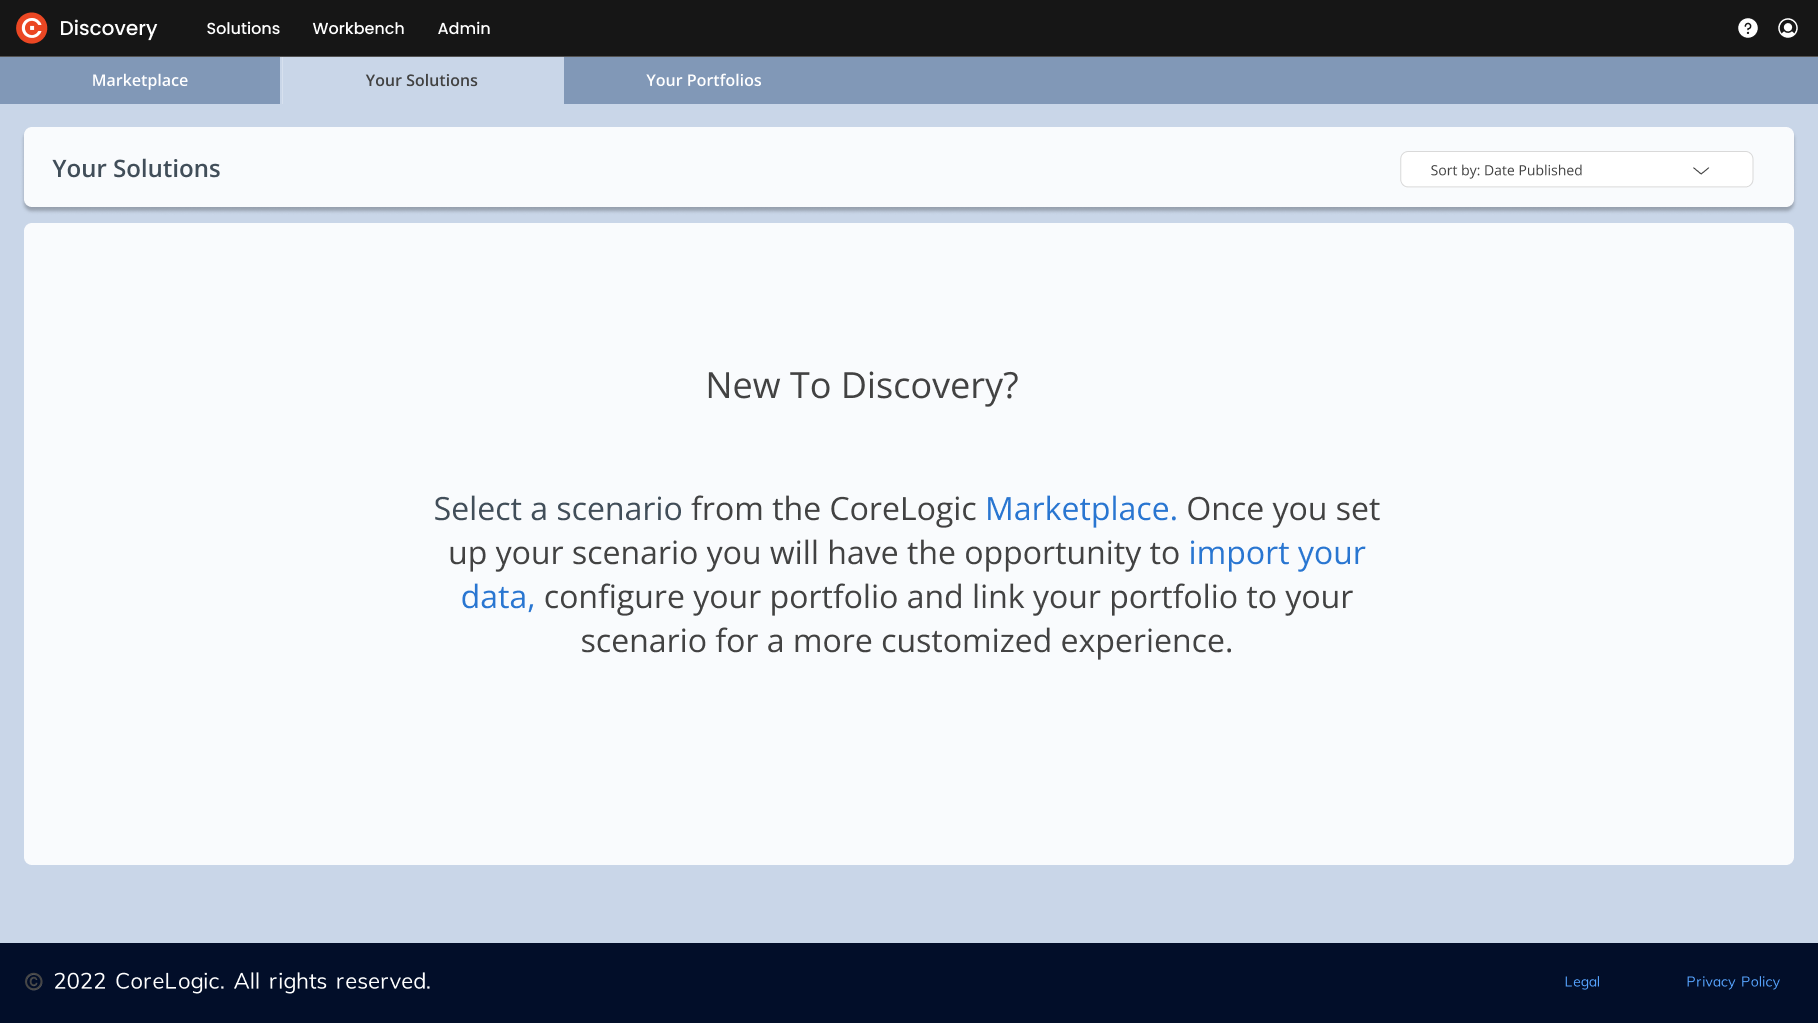
To create a Scenario, you need to complete a few fields of information. Each Scenario page will differ slightly depending on which Use Case you are using. If you are creating your first Scenario and click on the Your Solutions page, you will see this message.
Go to the Marketplace and select which Use Case you want to use to answer your business question. (For demonstration we’ve selected LMI Lending.)
Click on “Learn more” on the Use Case tile.
On the next page, click the “Get Started” button. You will immediately be taken to the “Configure New Scenario” page (see below, now under the “Your Solutions” tab), where you can begin setting up your scenario.
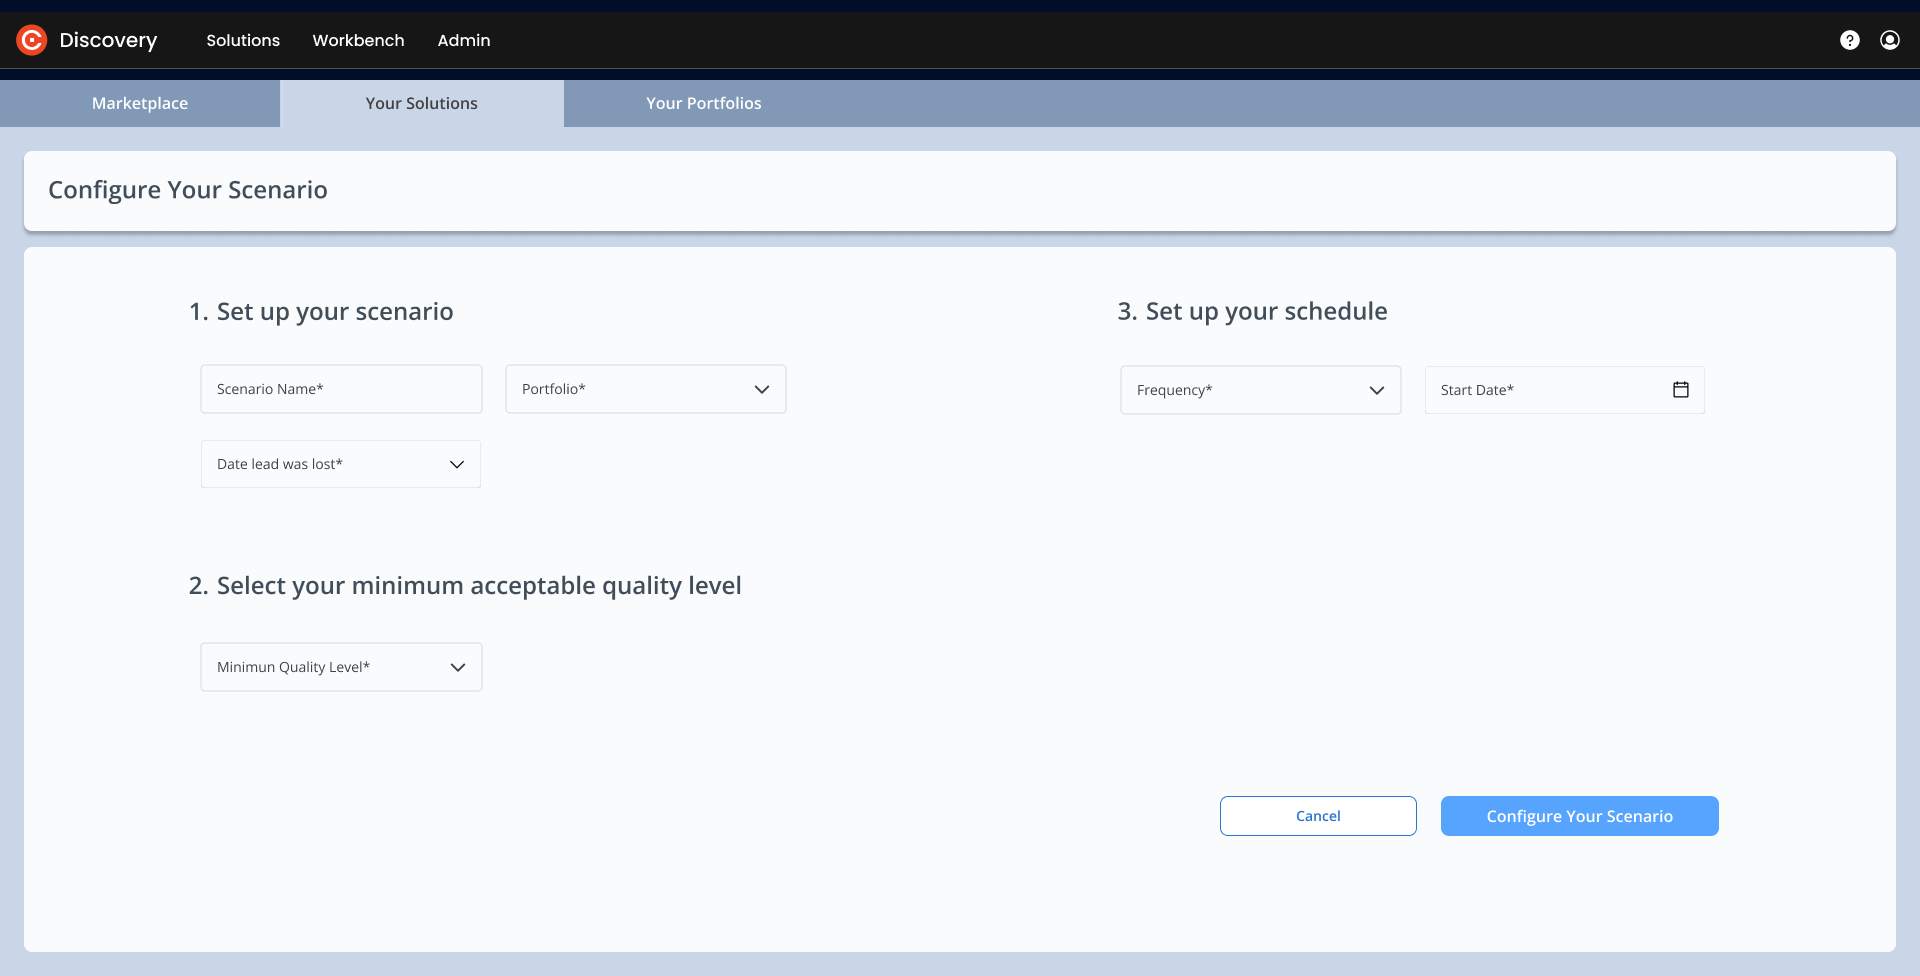
4. Complete the Source Data information (requested information will vary by use case). Any field with a asterisk is required:
Create a name for your scenario.
Choose your minimum acceptable quality CLIP level
Select the Start date and how frequently you want to update your Scenario.
When you’ve finished, click on the “Configure Your Scenario” button on the bottom right.
A green pop-up message will let you know when your scenario is configured. You will you scenario appear as a blue tile. Click on it.
-20230901-201225.png?inst-v=f41c3a66-ac8d-463d-bda6-35cb316a71a6)
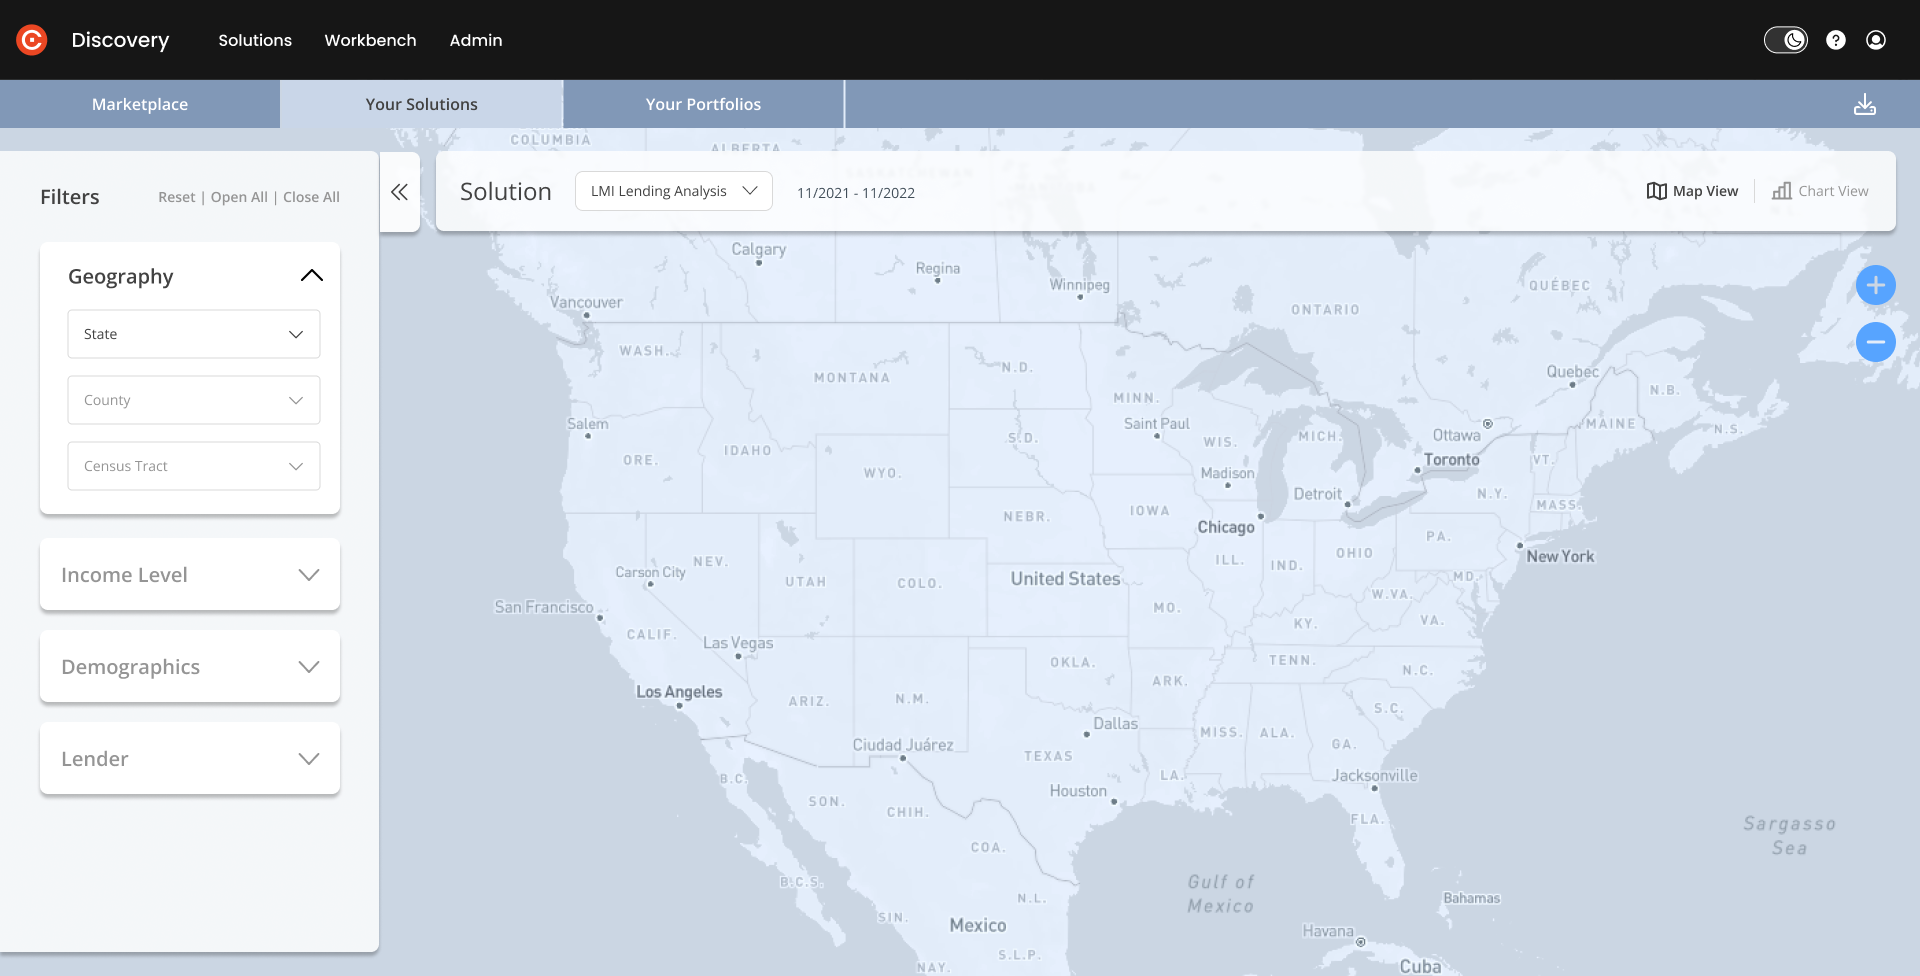
If you have configured your scenario to run today, you should see the screen below. If not, you may see a pop-up message that says “Your scenario hasn’t been scheduled to run yet.” Clicking on the blue “Run” button will run your scenario immediately.
Solution Insights
Once you have completed the steps above, the platform will immediately run your scenario, and your new Solution will appear as a heatmap of the U.S., highlighting your competitors’ footprint.
The image below shows the Solution page for Lost Leads, after a scenario has been run.
On the left of your screen, you will see the filters that allow you to further adjust the view, select a specific state and county, zoom in on a census tract within that county, and view a list of Leading Lenders in the area. On the right of the screen, you can see more detailed insights into the types of loans within the specified area. These exact filters and insights will vary by Use Case, but they will generally appear on the same parts of the screen – Filters on the left, Insights on the right, Solution details and Map/Chart view across the top.
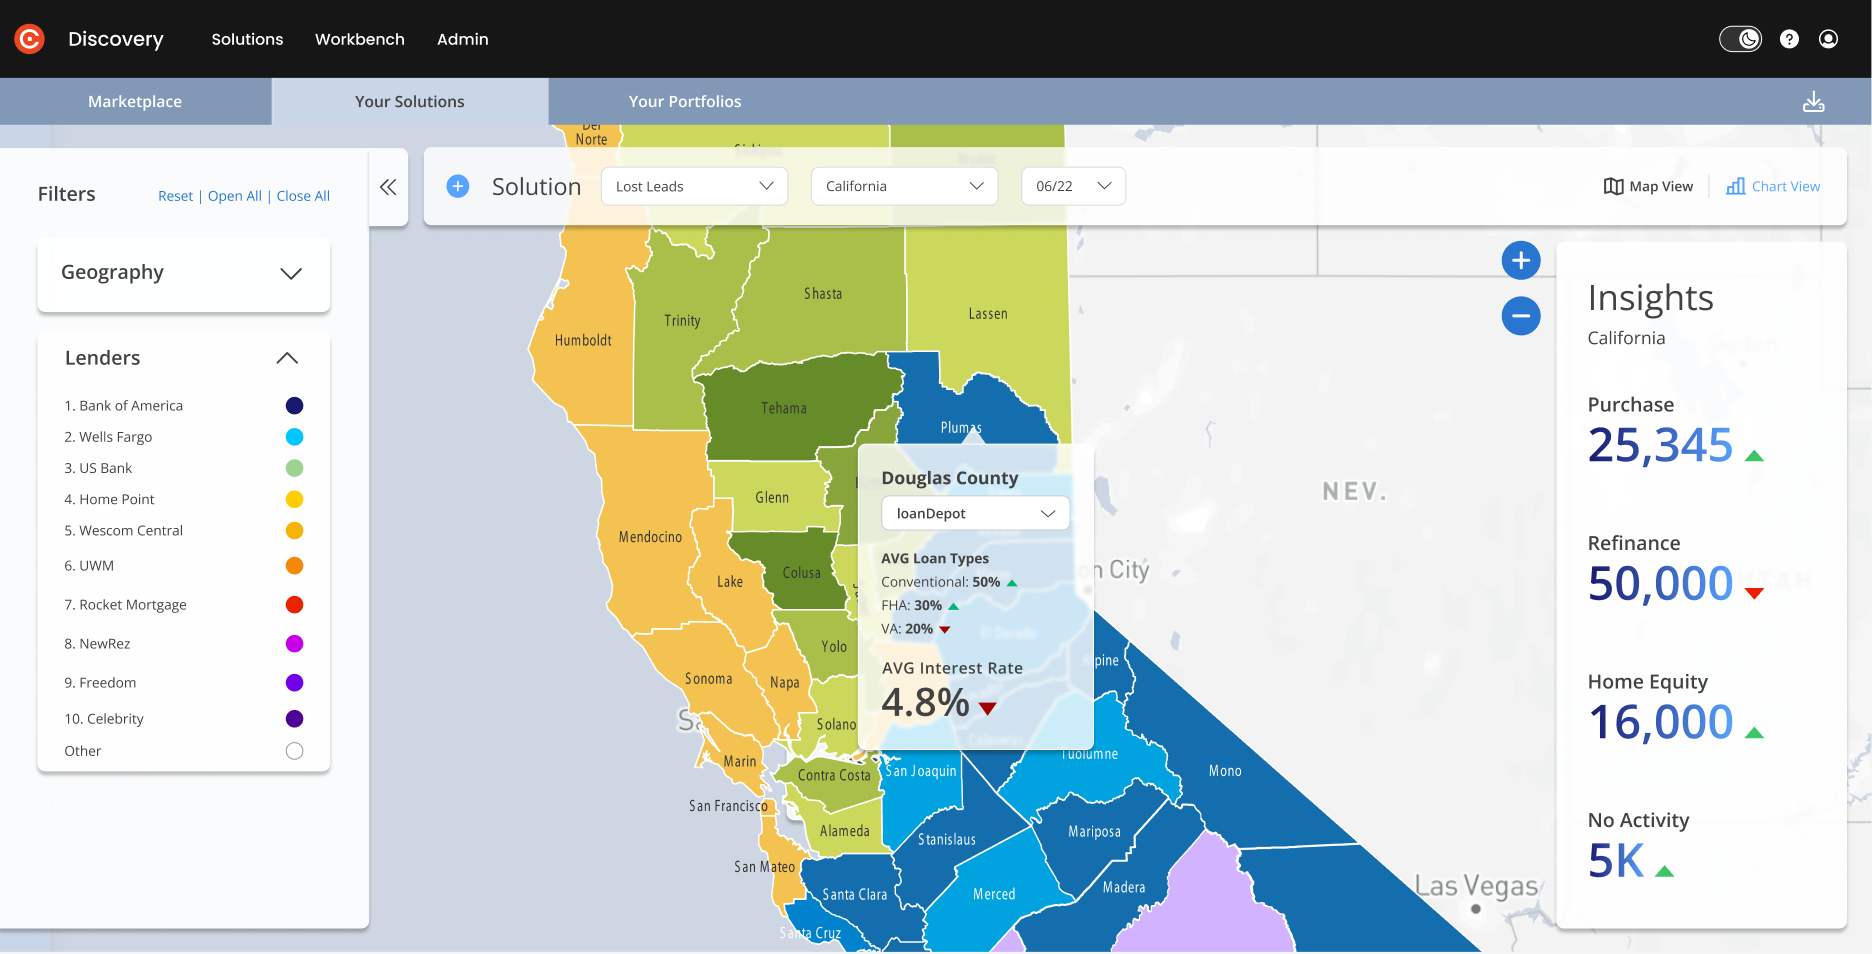
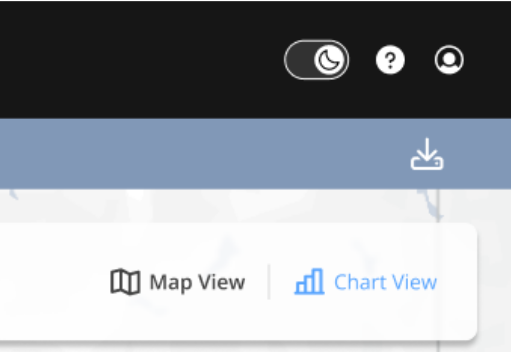
On the top bar of your screen, on the far right, you can switch from Map view to Chart view, which provides further details and insights, in the form of charts, graphs and lists.
You can then download your insights in the form of a PDF or CSV file, using the export icon on the top right of your screen.
Your Solution will now be available under the Your Solutions tab, where you can review your results any time, across different time periods, in different visual displays and different target areas. And you can easily summarize and manage your scenarios, solutions and portfolios in one simple dashboard.
Related Pages:
