LMI Lending for Mortgage - User Experience
Step | Instruction | Details |
|---|---|---|
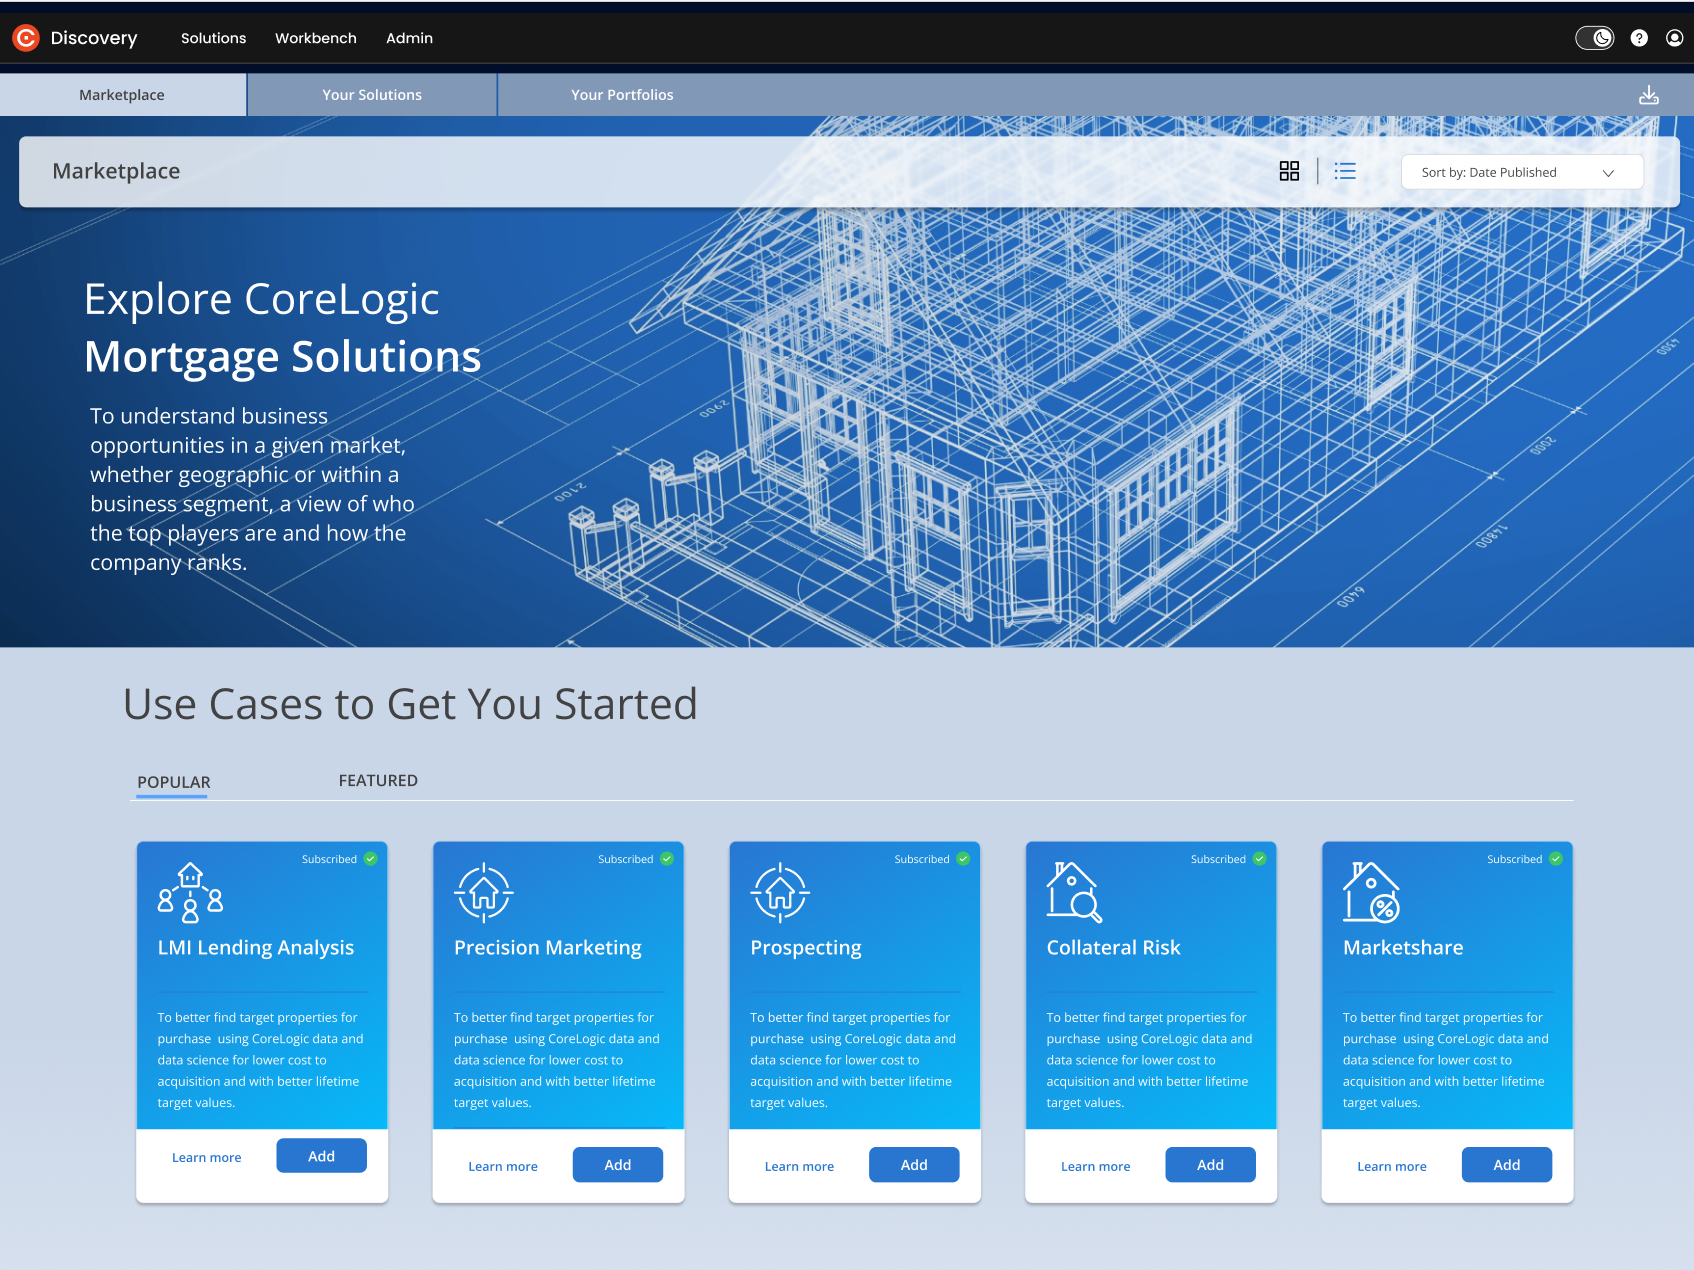
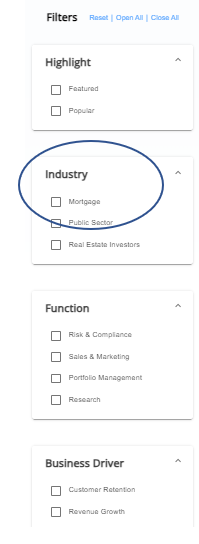
1 | The Marketplace | Begin at the Marketplace and select your industry from the dropdown menu. Then click on the “LMI Lending” Use Case. Click on “Learn More”. |
  | ||
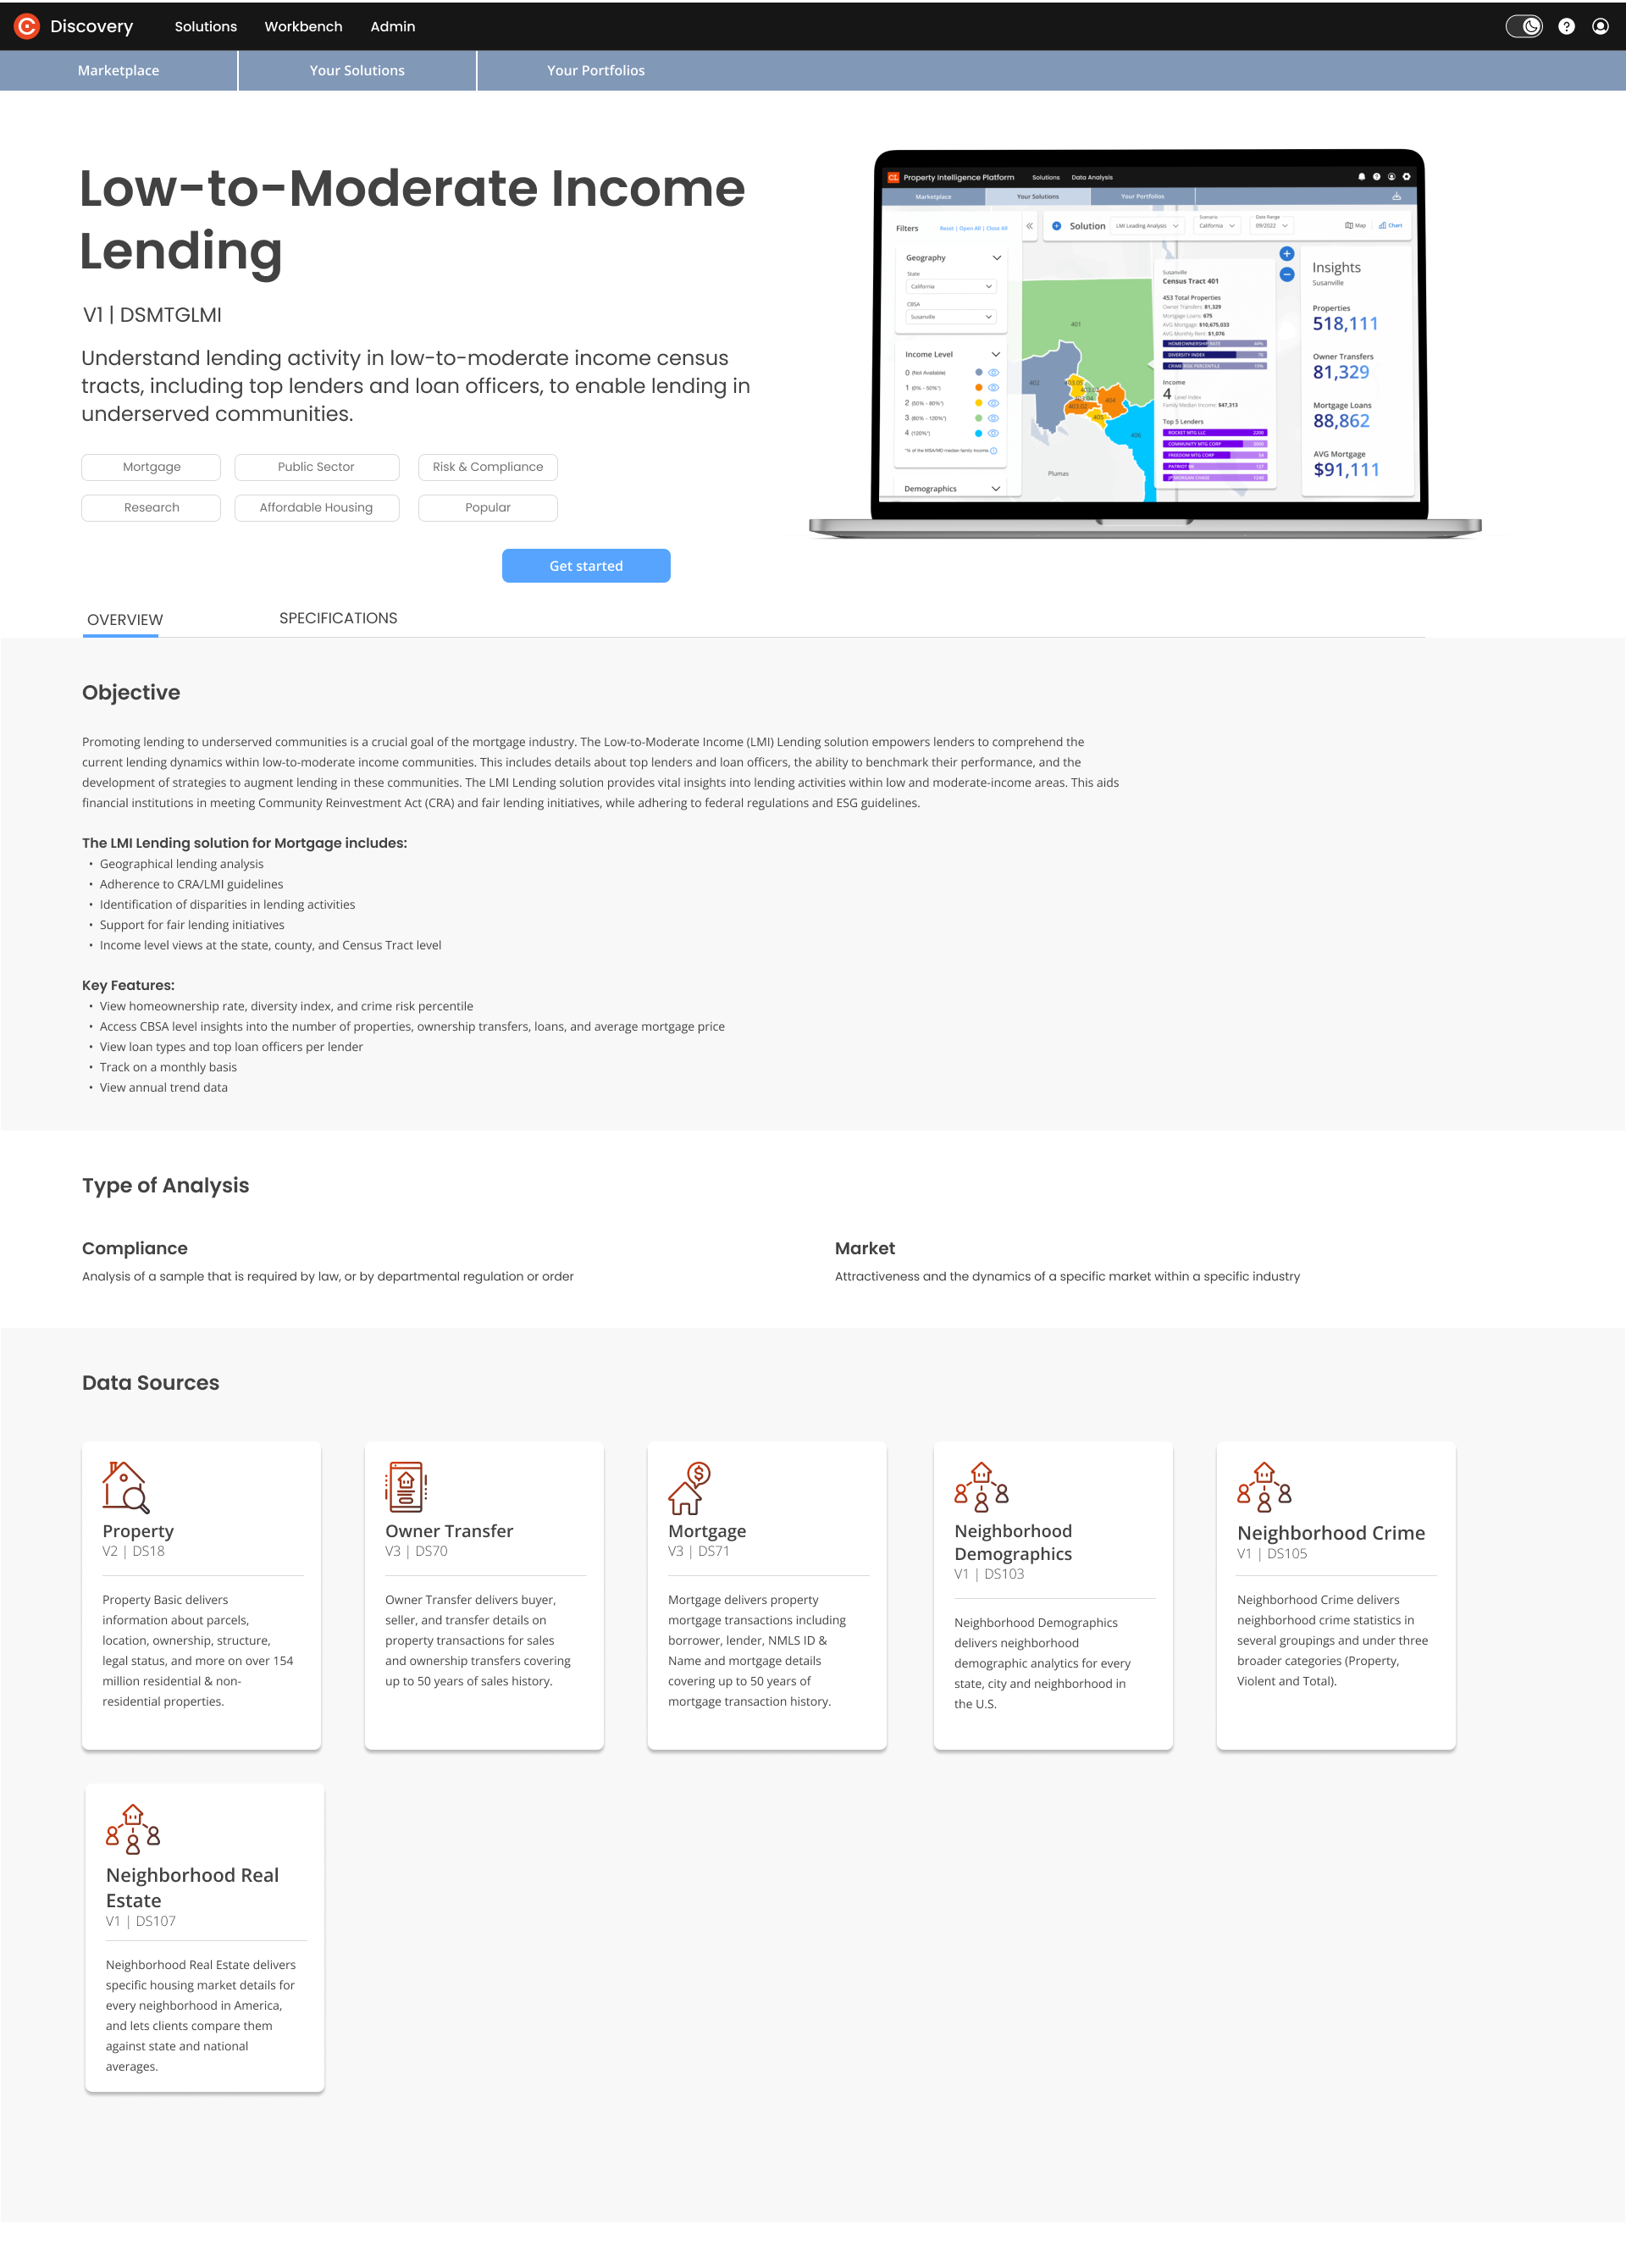
2 | LMI Lending Detail Page | From here, you can learn more about the Solution or select “Get started”, which takes you to the “Create Scenario” screen. |
 | ||
3 | Create Your Scenario | On the New Scenario page, complete all the filters. Fields with an asterisk are required:
This will take you to your dashboard where you will see the newly created scenario. |
-20230906-164143.png?inst-v=f41c3a66-ac8d-463d-bda6-35cb316a71a6) 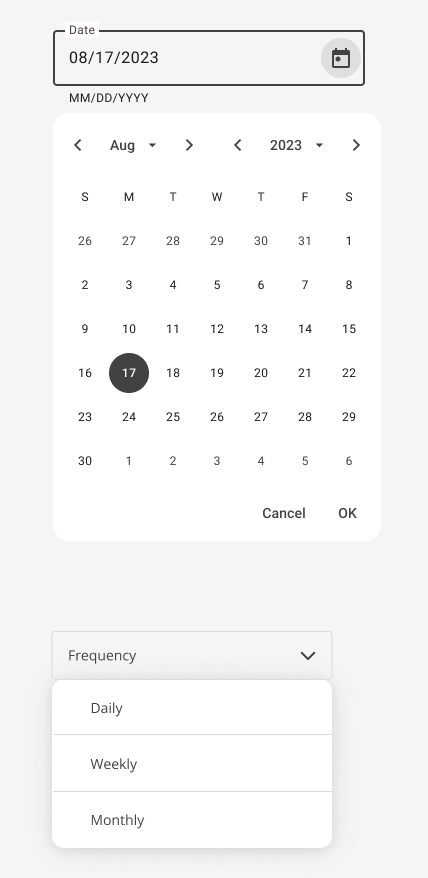 | ||
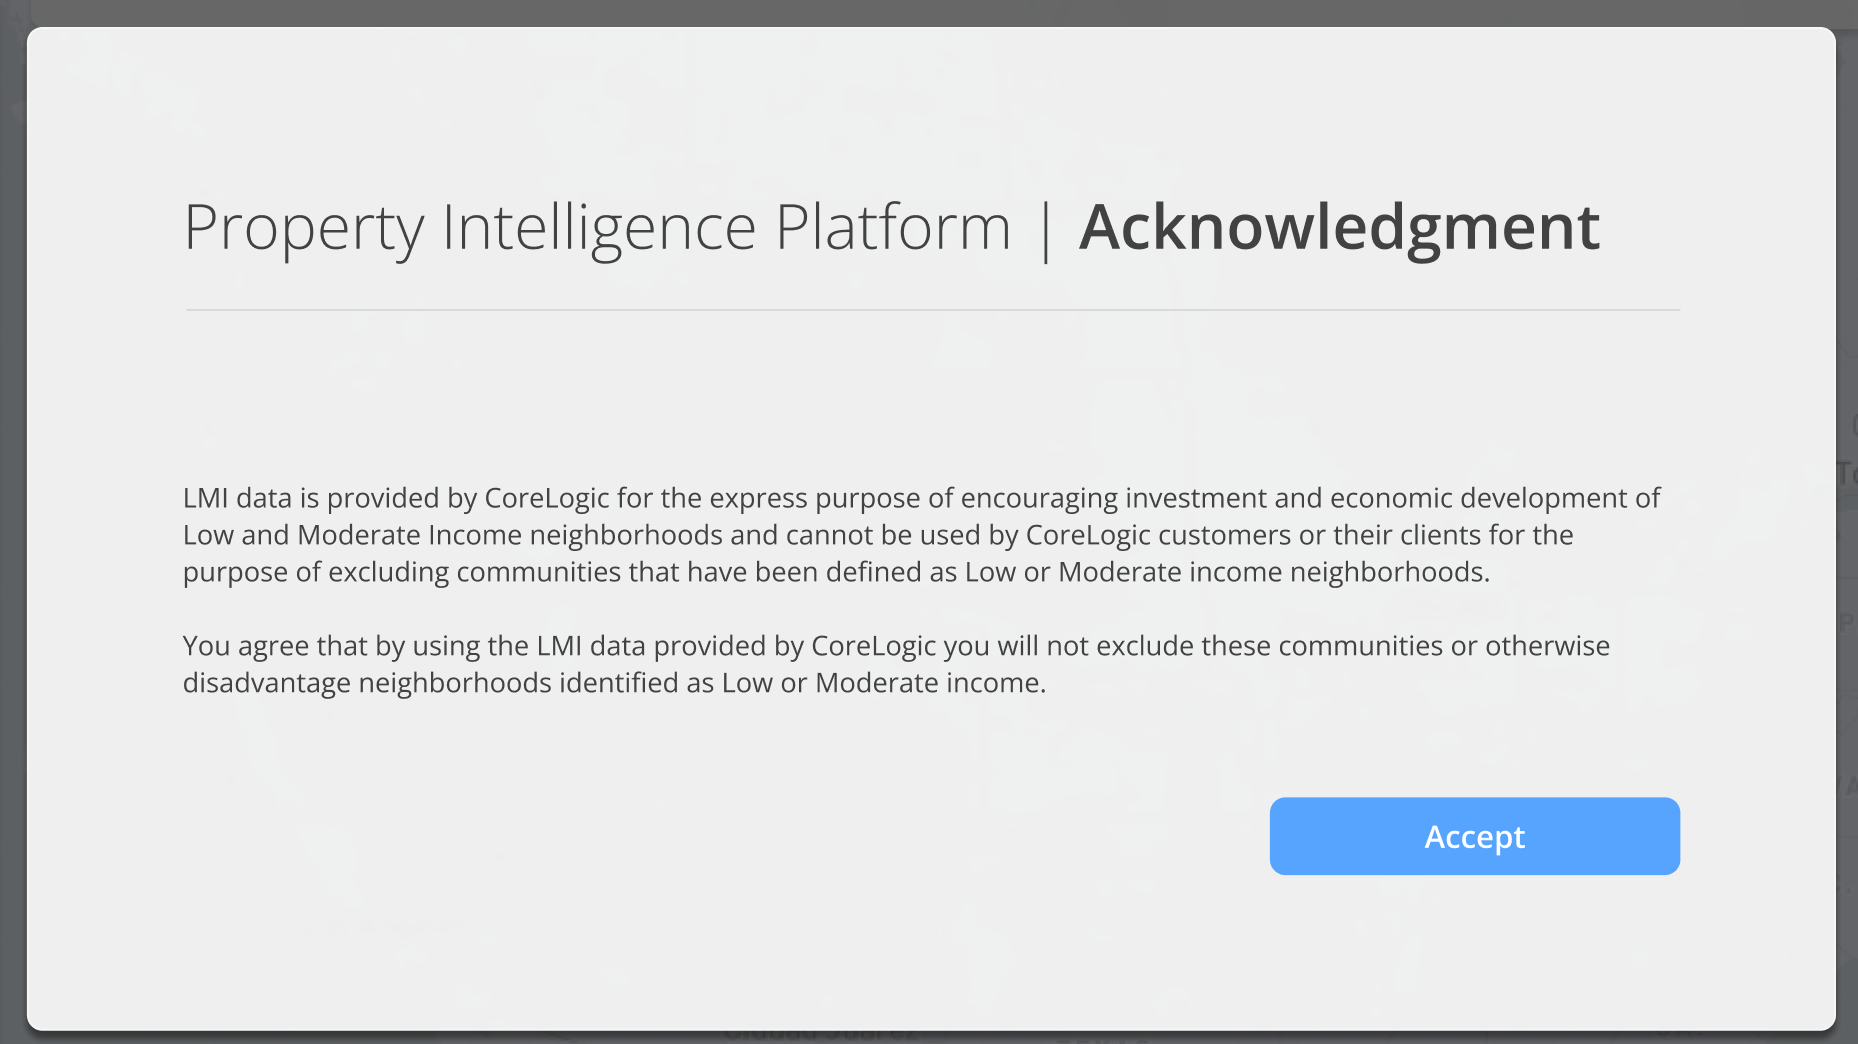
4 | Notice | The acknowledgment notice appears the first time you access the solution. Click the “Accept“ button to go to your solution. |
 | ||
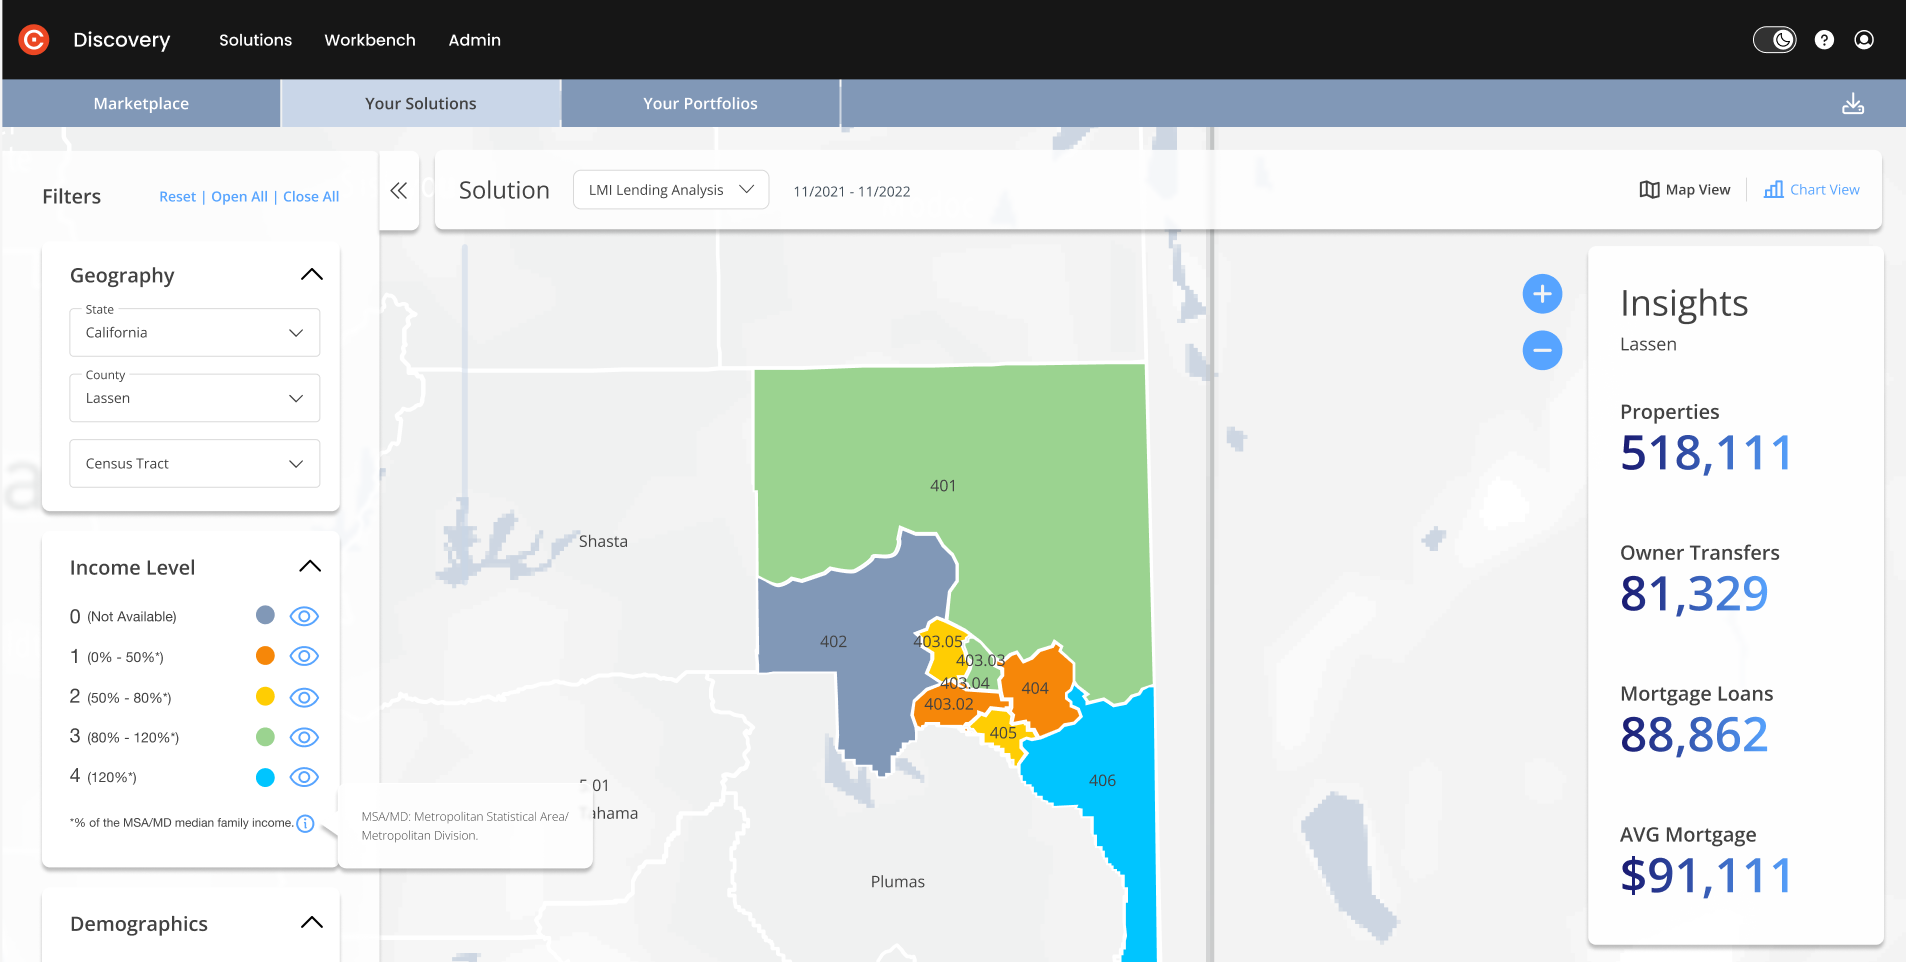
5 | Default Map View | Filters and Use Case bar: This is the first page of your solution.
|
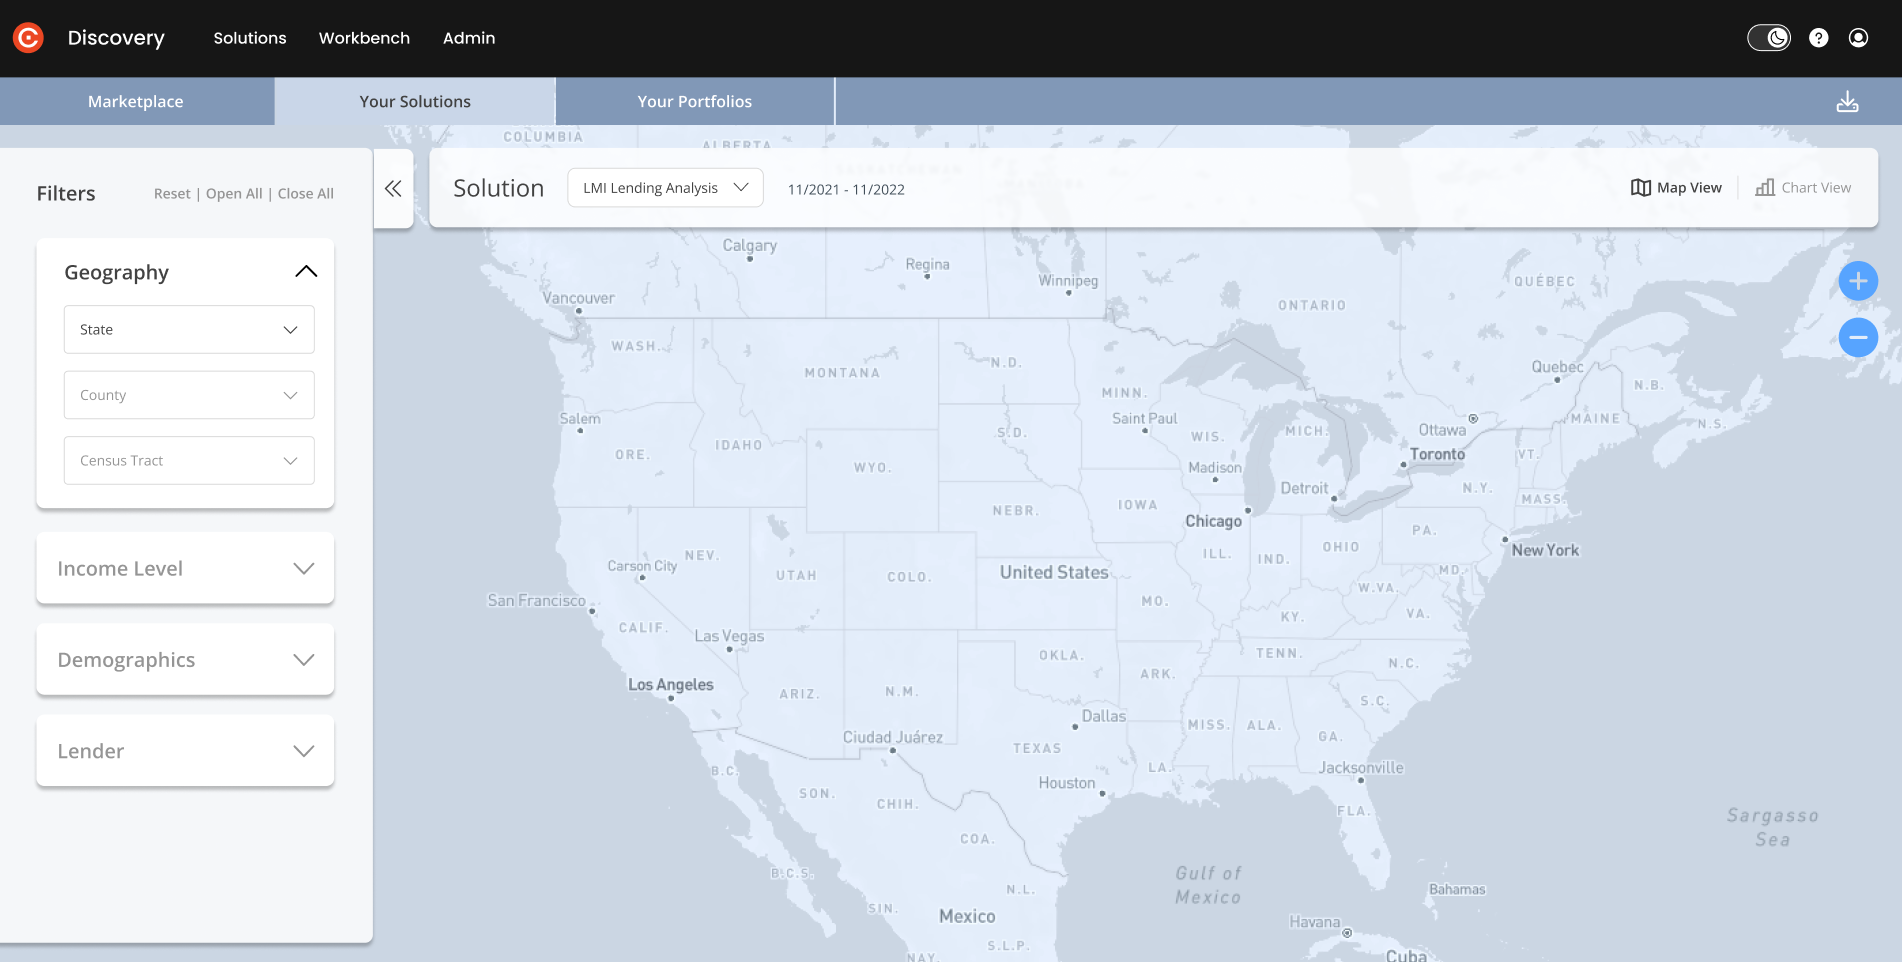 | ||
6 | Filter by State and then narrow by County |
|
 | ||
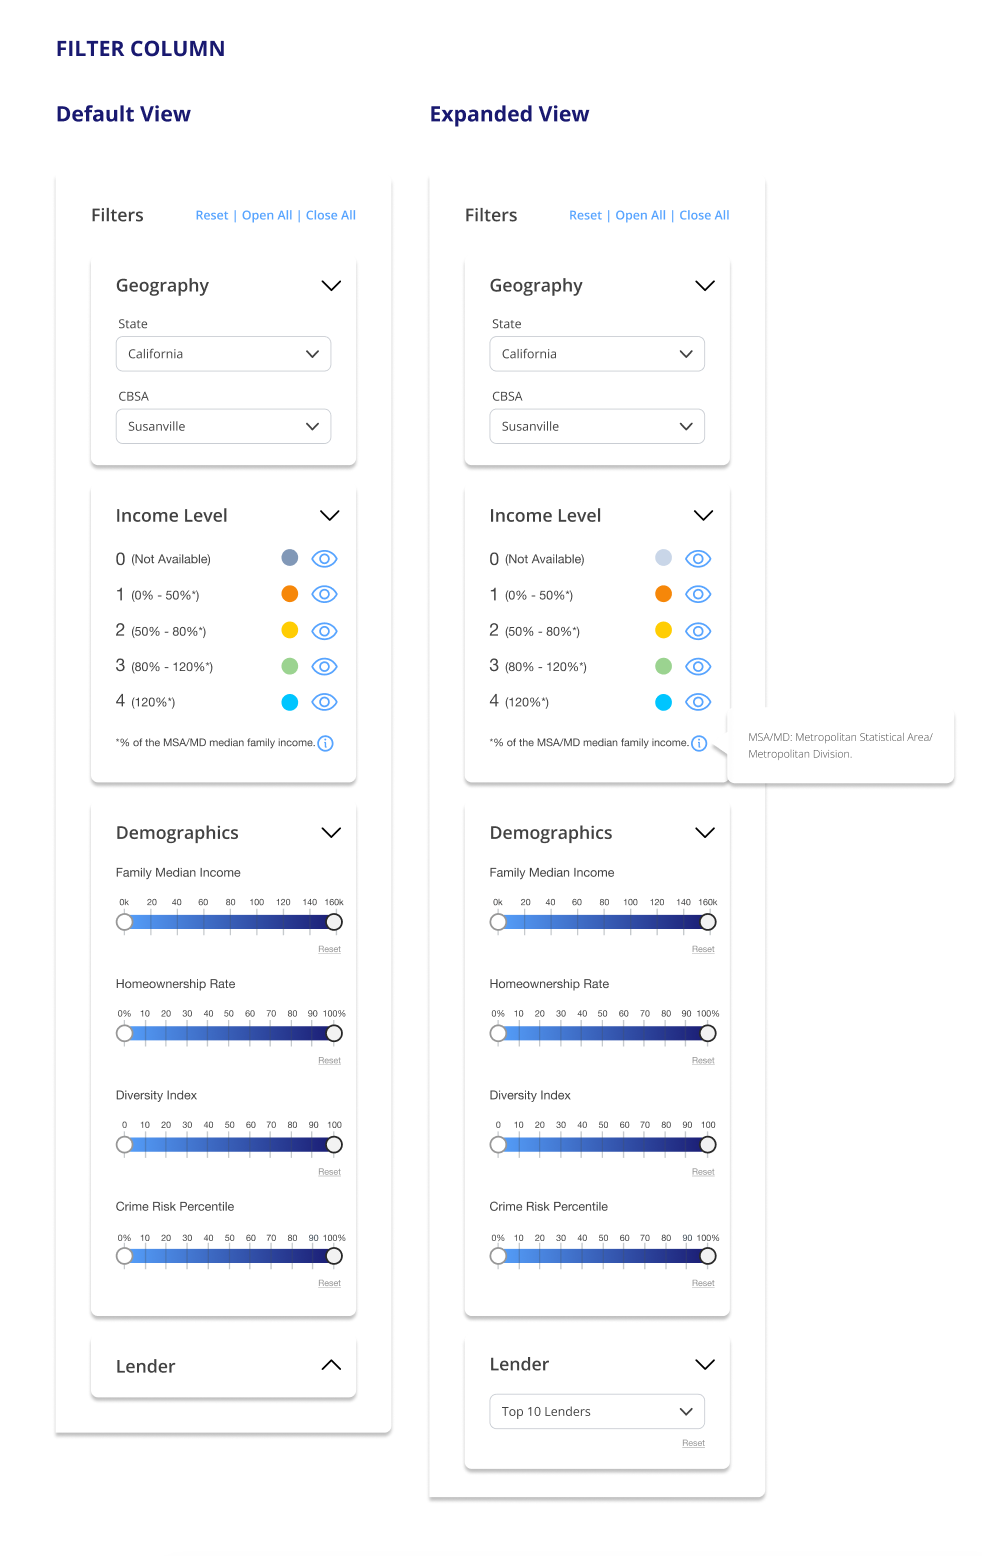
7 | Filters | This is the view of all the filters when they are expanded. Geography filter: The County dropdown will list the available counties within the state. The blue “Reset“ button resets the Income level, Demographics and Lender filter groups, but not the Geography filter. Income Level filter: Income Level choices are based on the % of the Metropolitan Statistical Area/Metropolitan Division definition. Demographics filter: Includes Median Family Income, Homeownership Rate, Diversity Index, and Crime Risk Percentile, with a fixed scale. Lender filter: The Lender filter will present the top 10 lenders in the selected geography. You may also choose to view one Lender at a time. |
 | ||
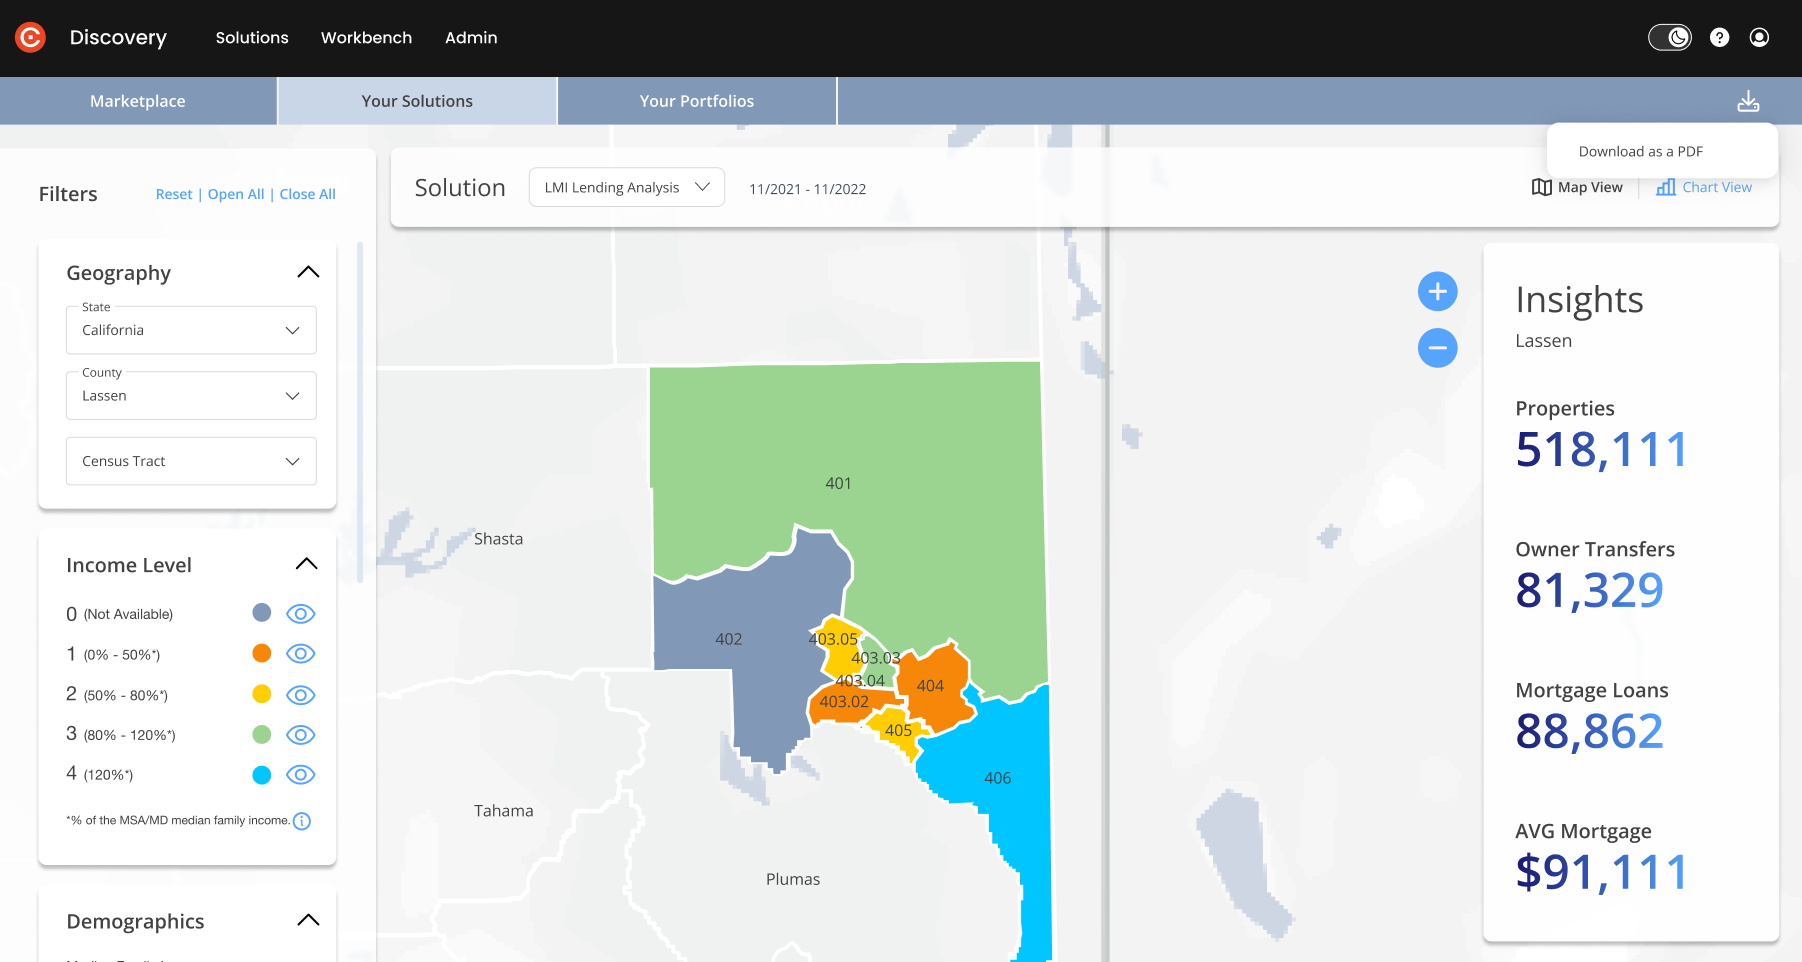
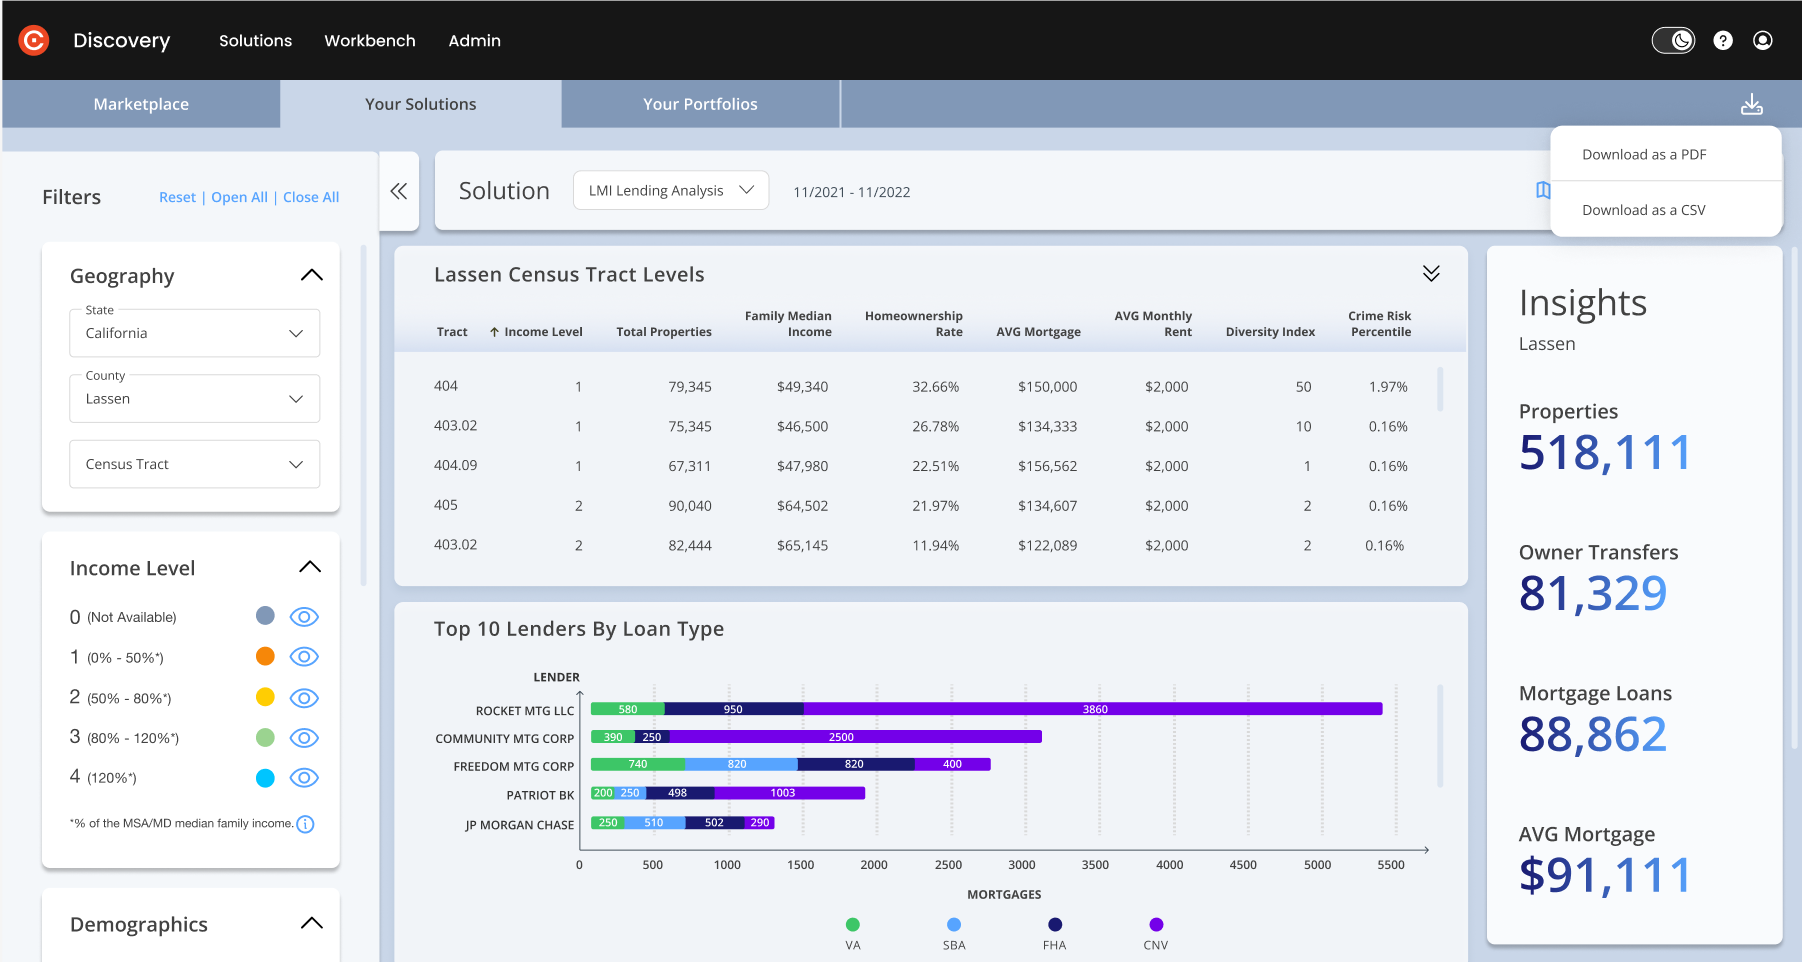
8 | Map View and Chart View with Insights |
|
  | ||
9 | Filter by County (Map View) | Once the County option is selected on the left:
|
 | ||
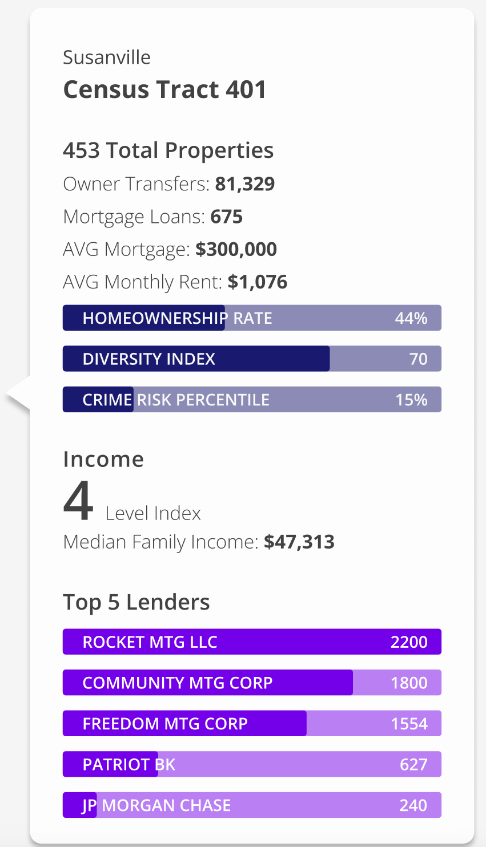
10 | Census tract detail information in Tooltip (Map View) | Census tract tooltip:
|
 | ||
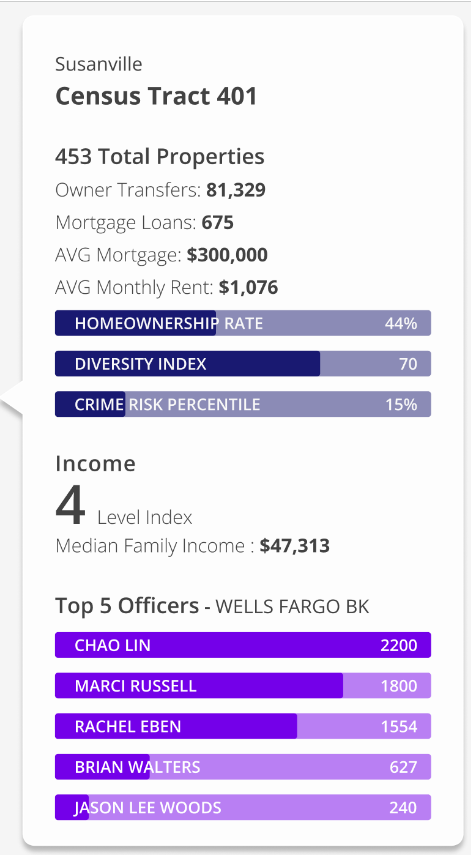
11 | Census tract Tooltip Content (Map View) | Census tract information in the tooltip: Homeownership Rate, Diversity Index, and Crime Risk Percentile bars: These bars present a percentage or proportion segment in full color for each value (out of 100 or 100%.) The Top 5 lenders bars:
|
 | ||
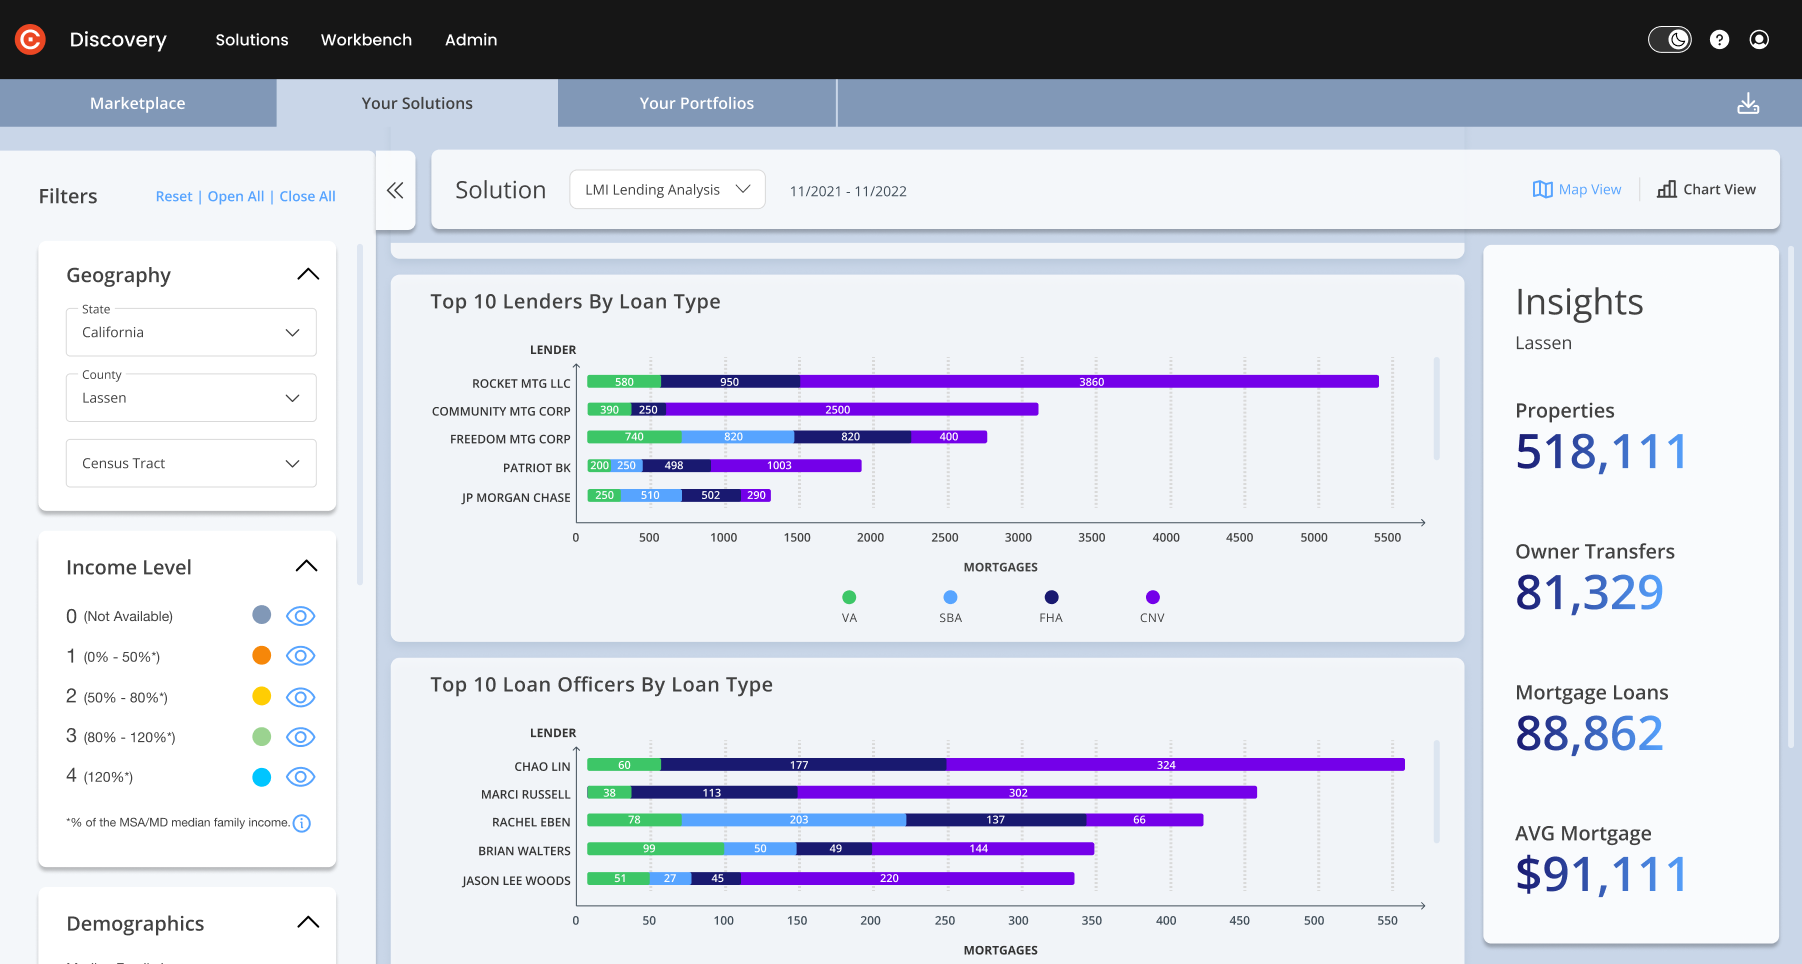
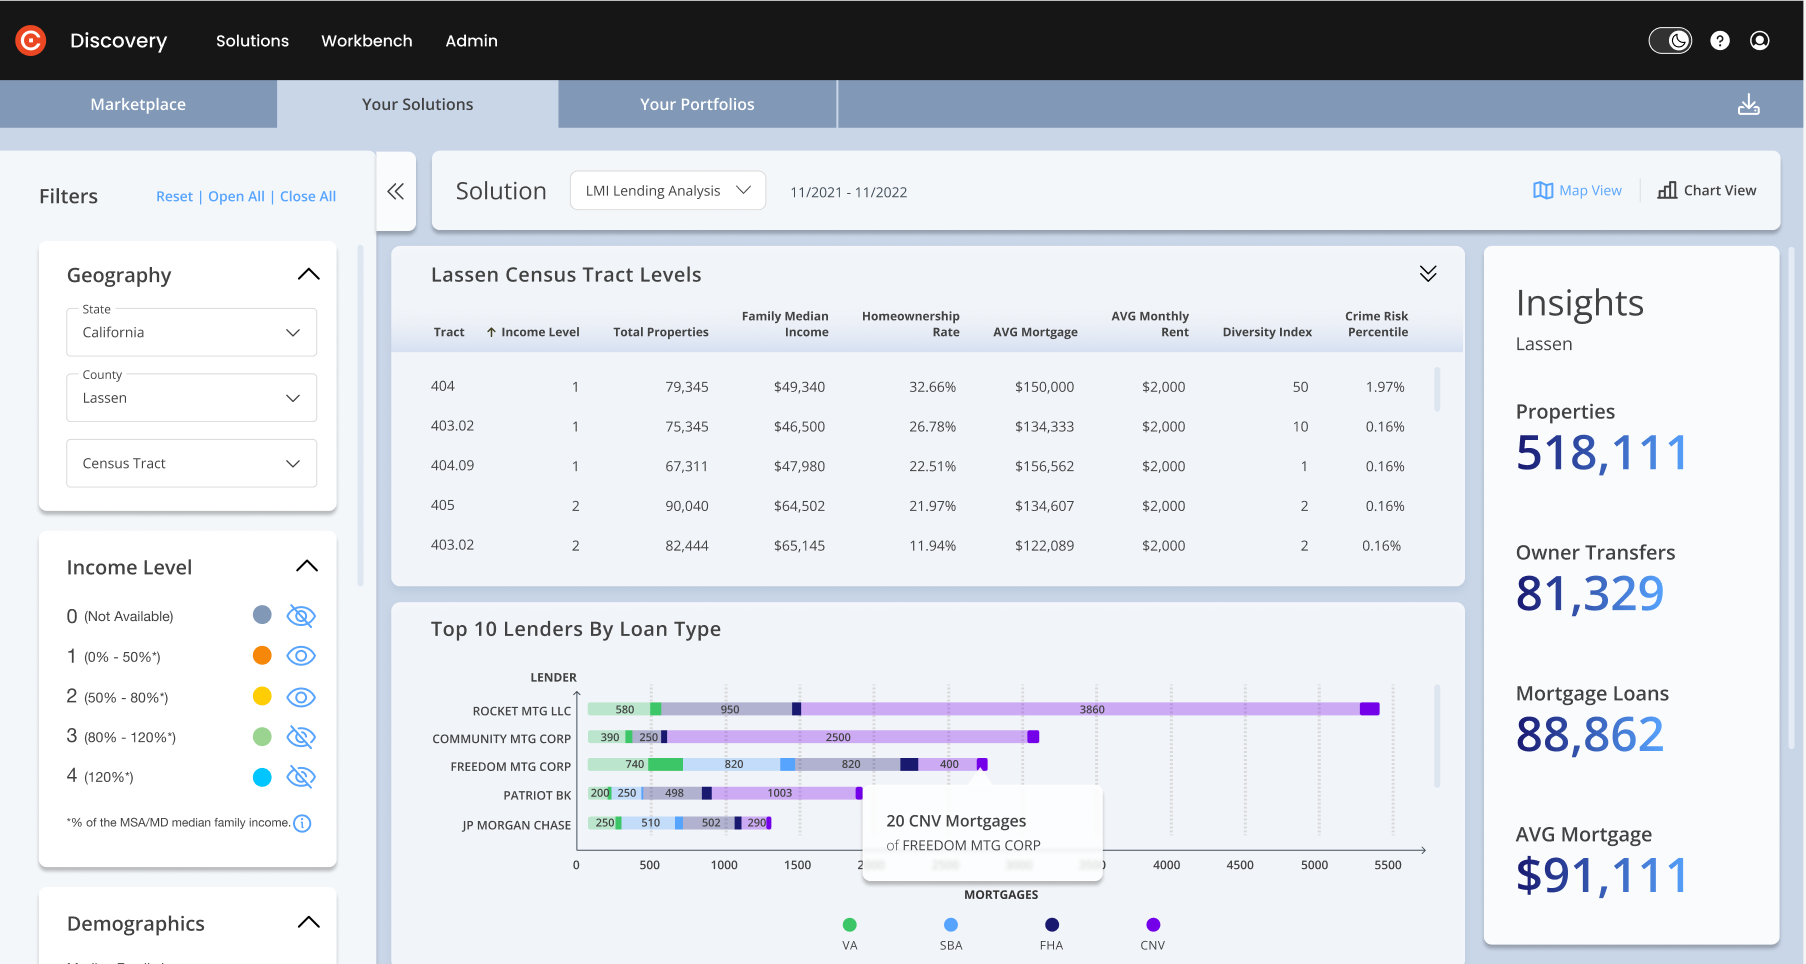
12 | Filter by County (Chart View) | Components in the center column:
|
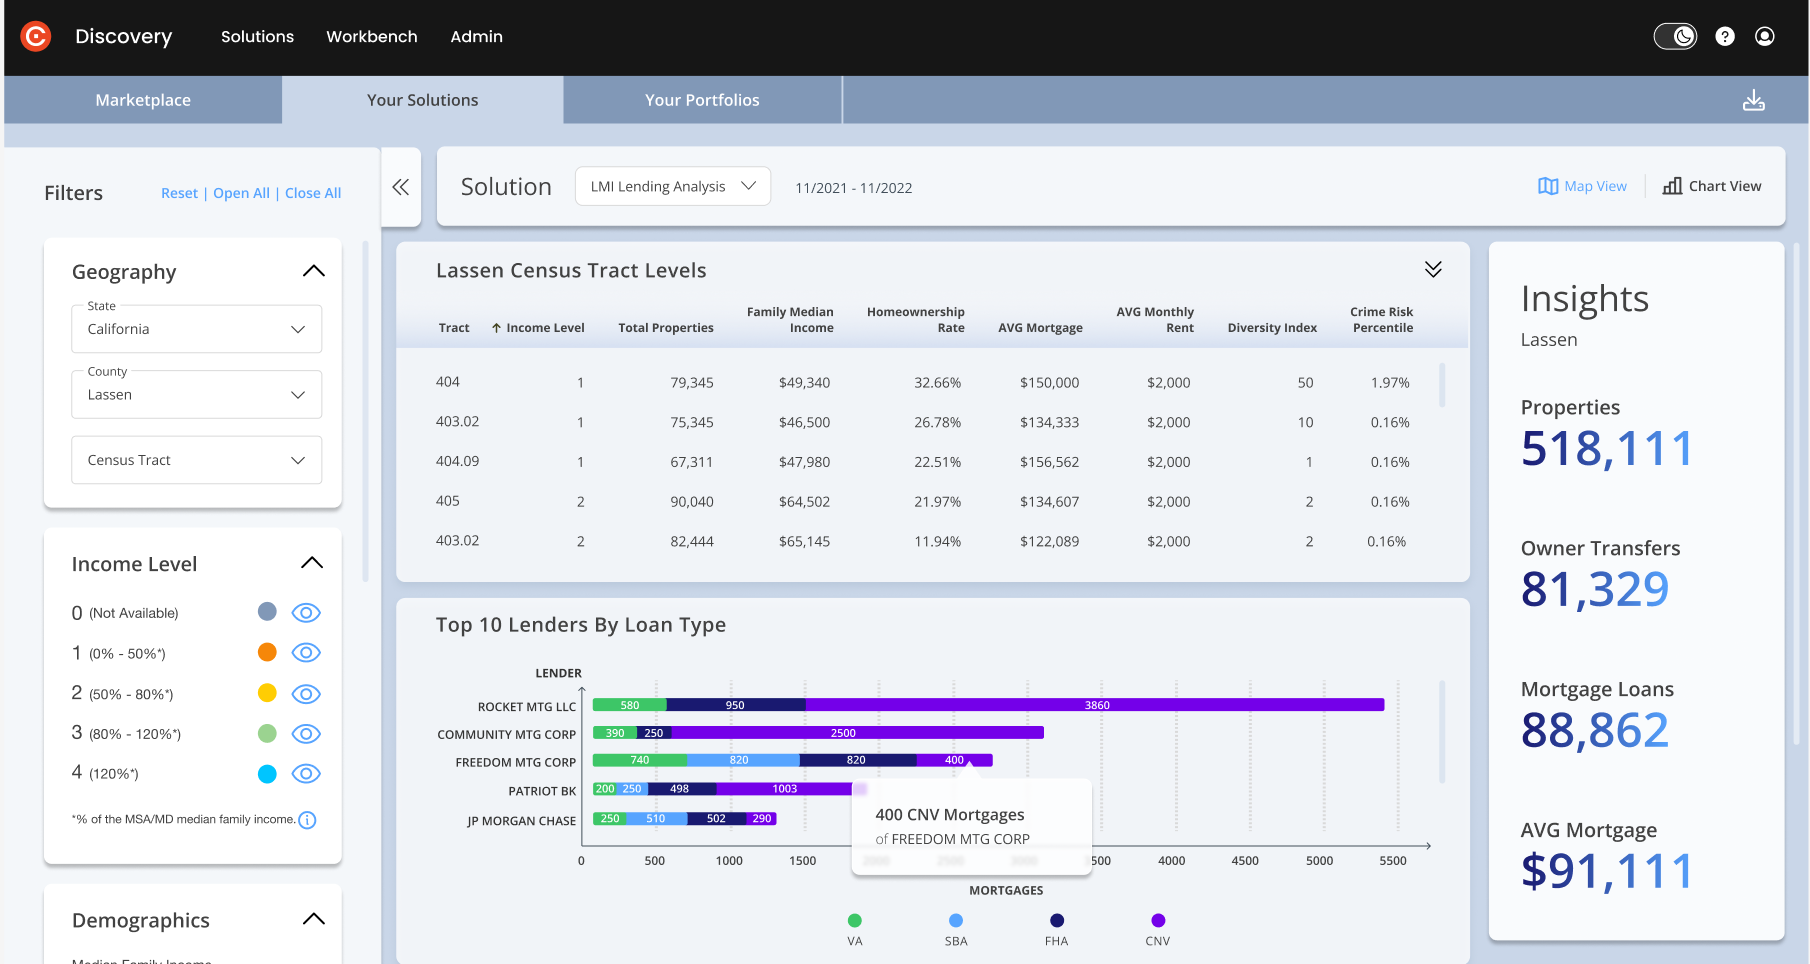  | ||
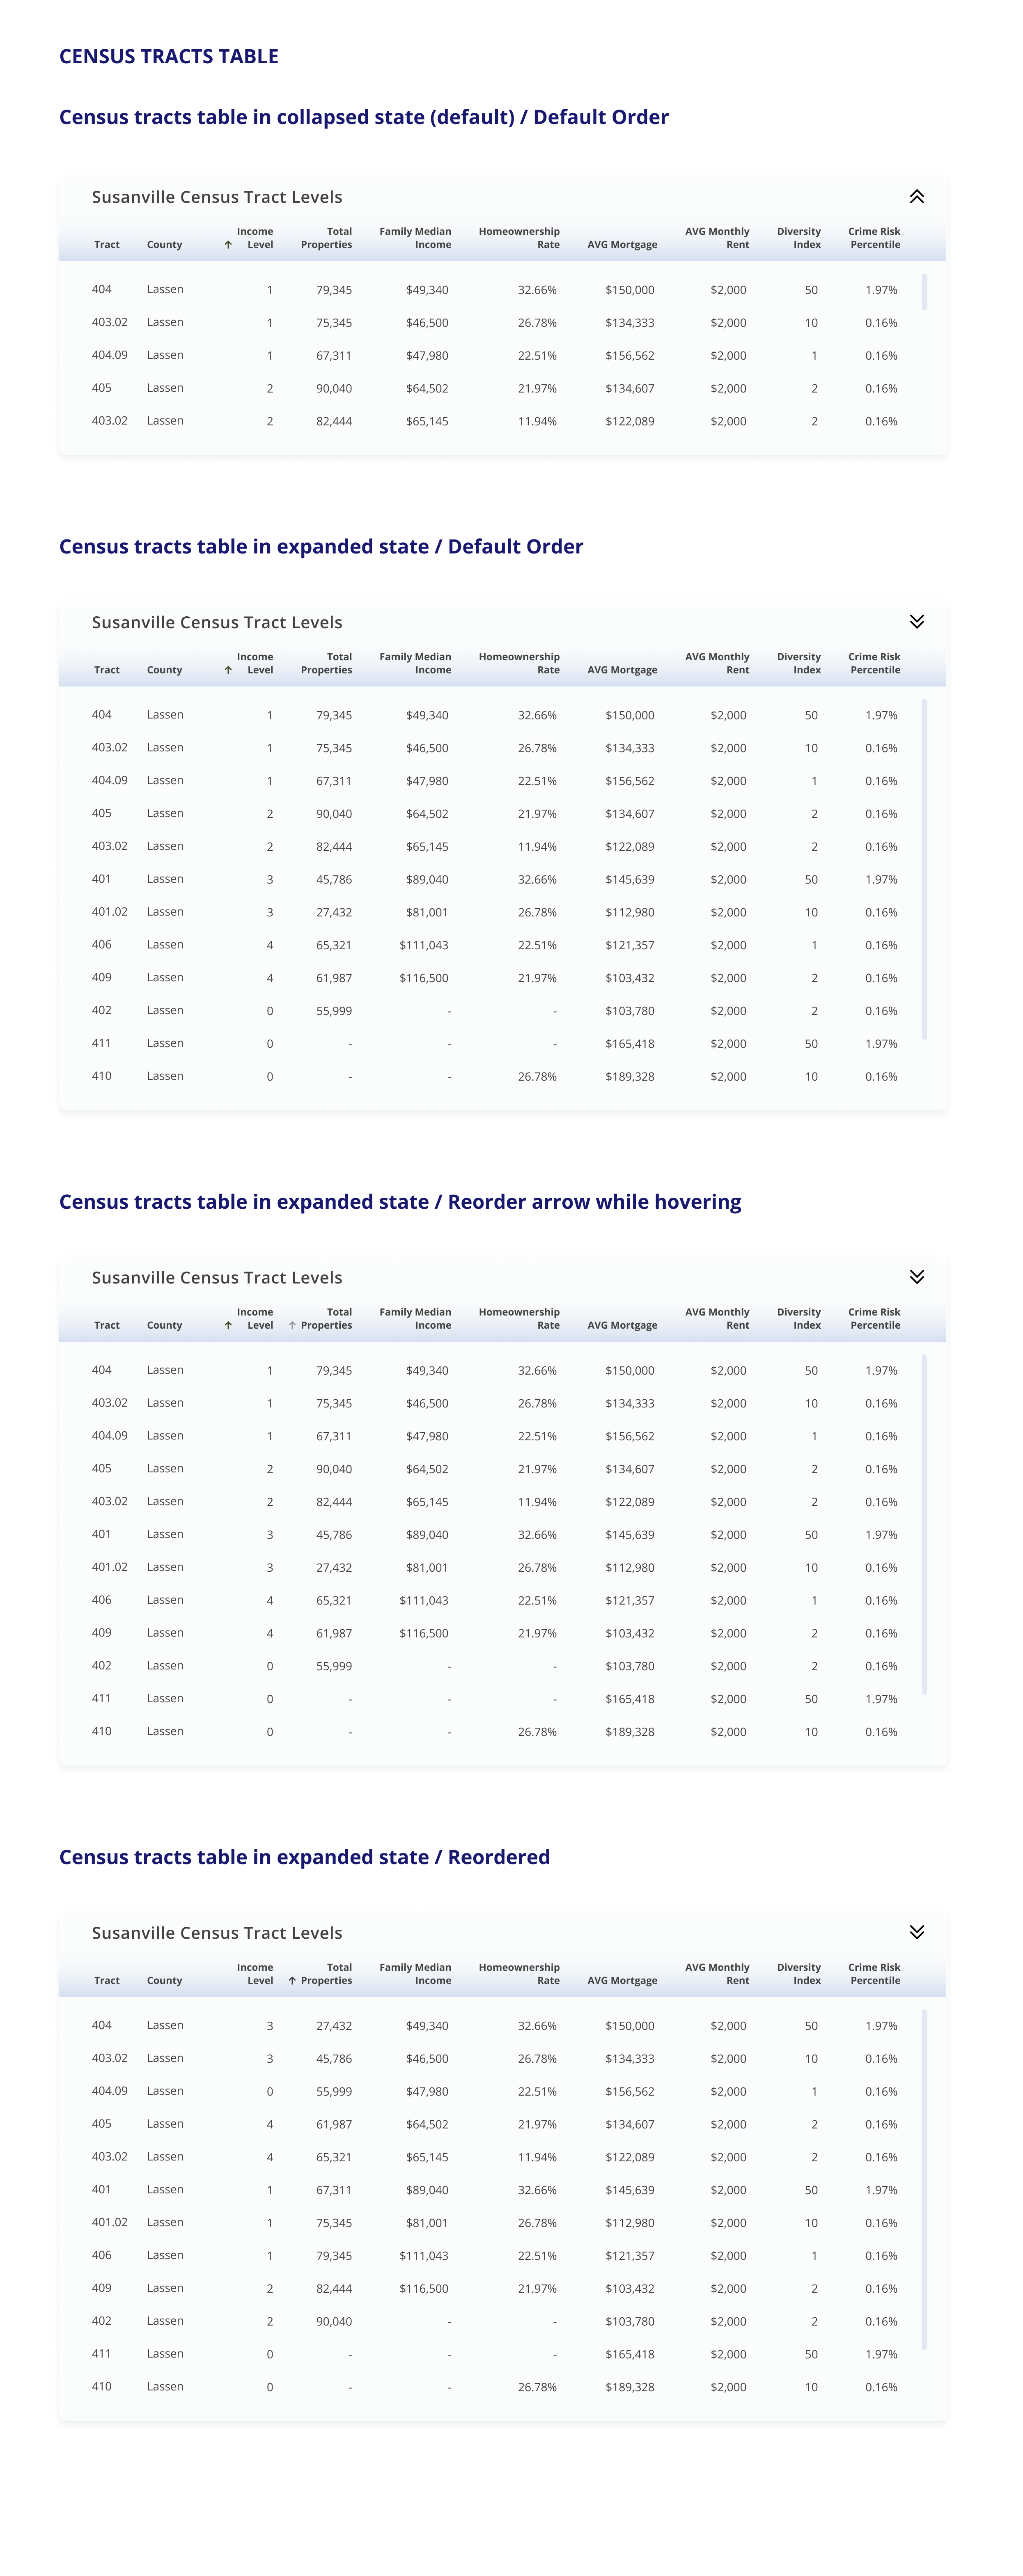
13 | Census Tracts Table (Chart View) | You can expand the number of rows in the Census Tracts Table from 5 to 12 by clicking on the double arrows on the top right of the table. You can also hover over the arrows next to Income Level and Total Properties to reorder the information. |
 | ||
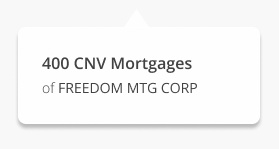
14 | Bar Chart Tooltip (Chart View) | While hovering over the bar chart, the tooltip will highlight the number of Mortgages per lender. |
 | ||
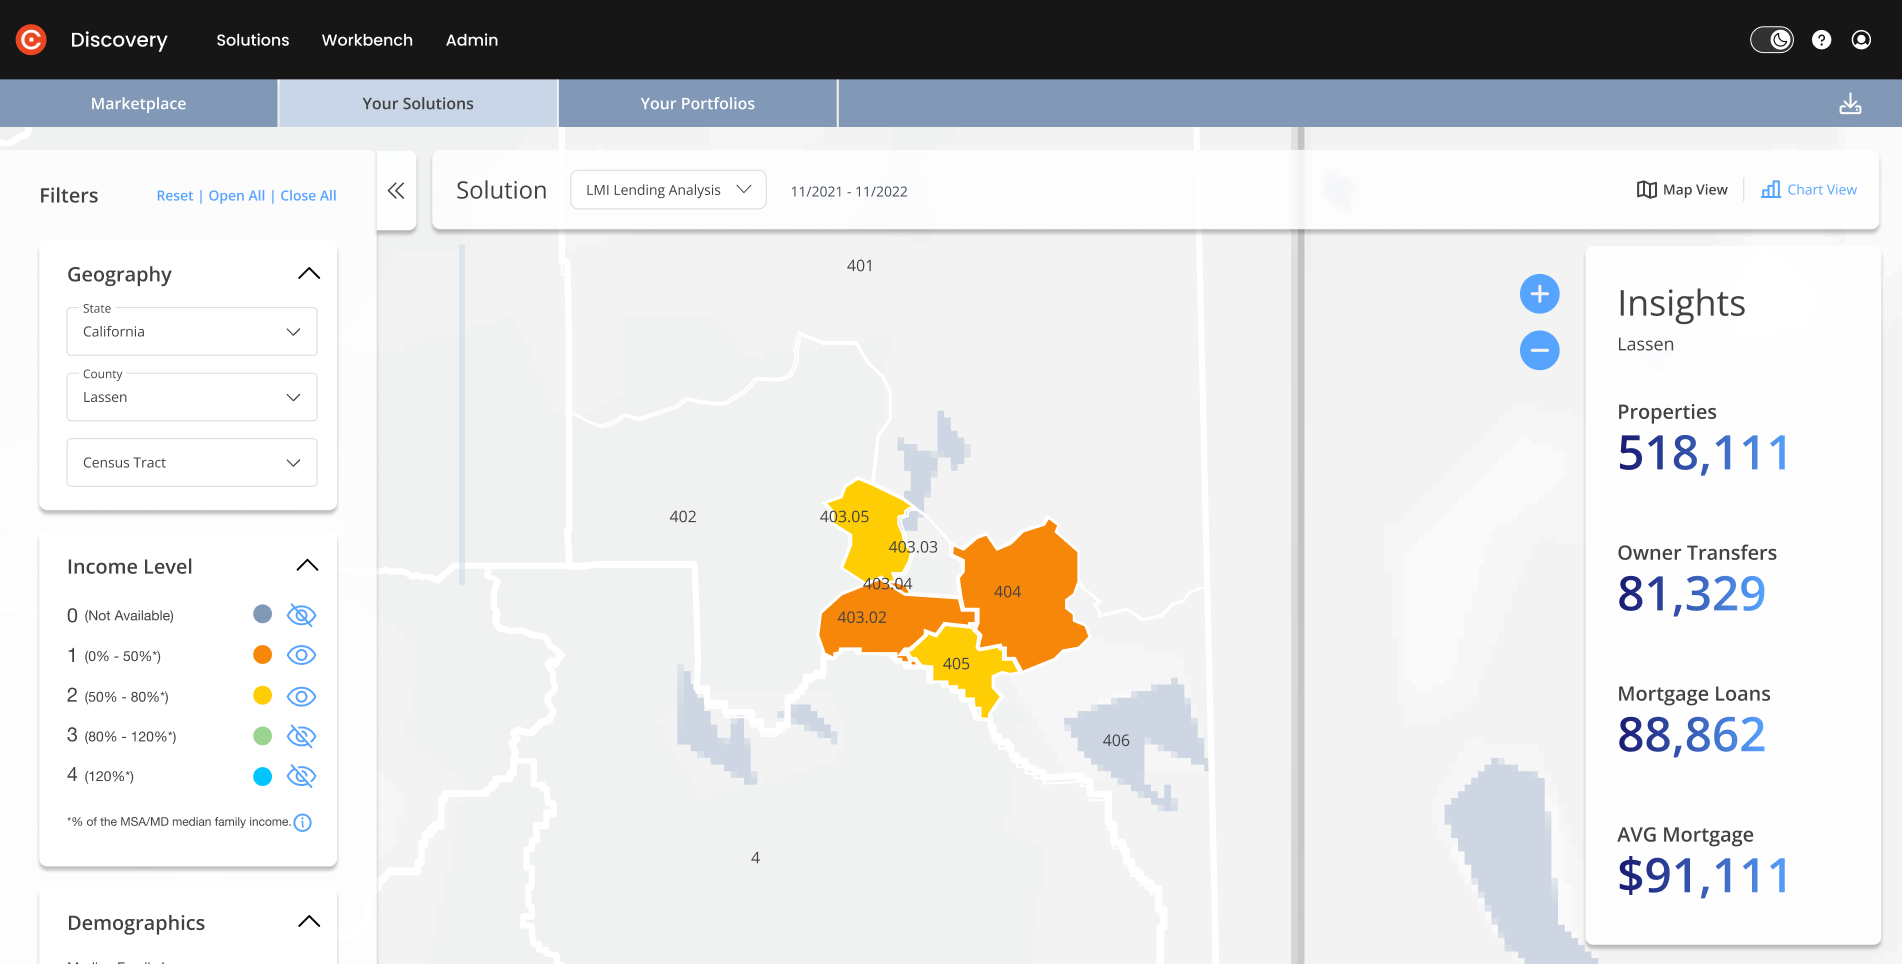
15 | Filter by Income Level (Map View) |
|
 | ||
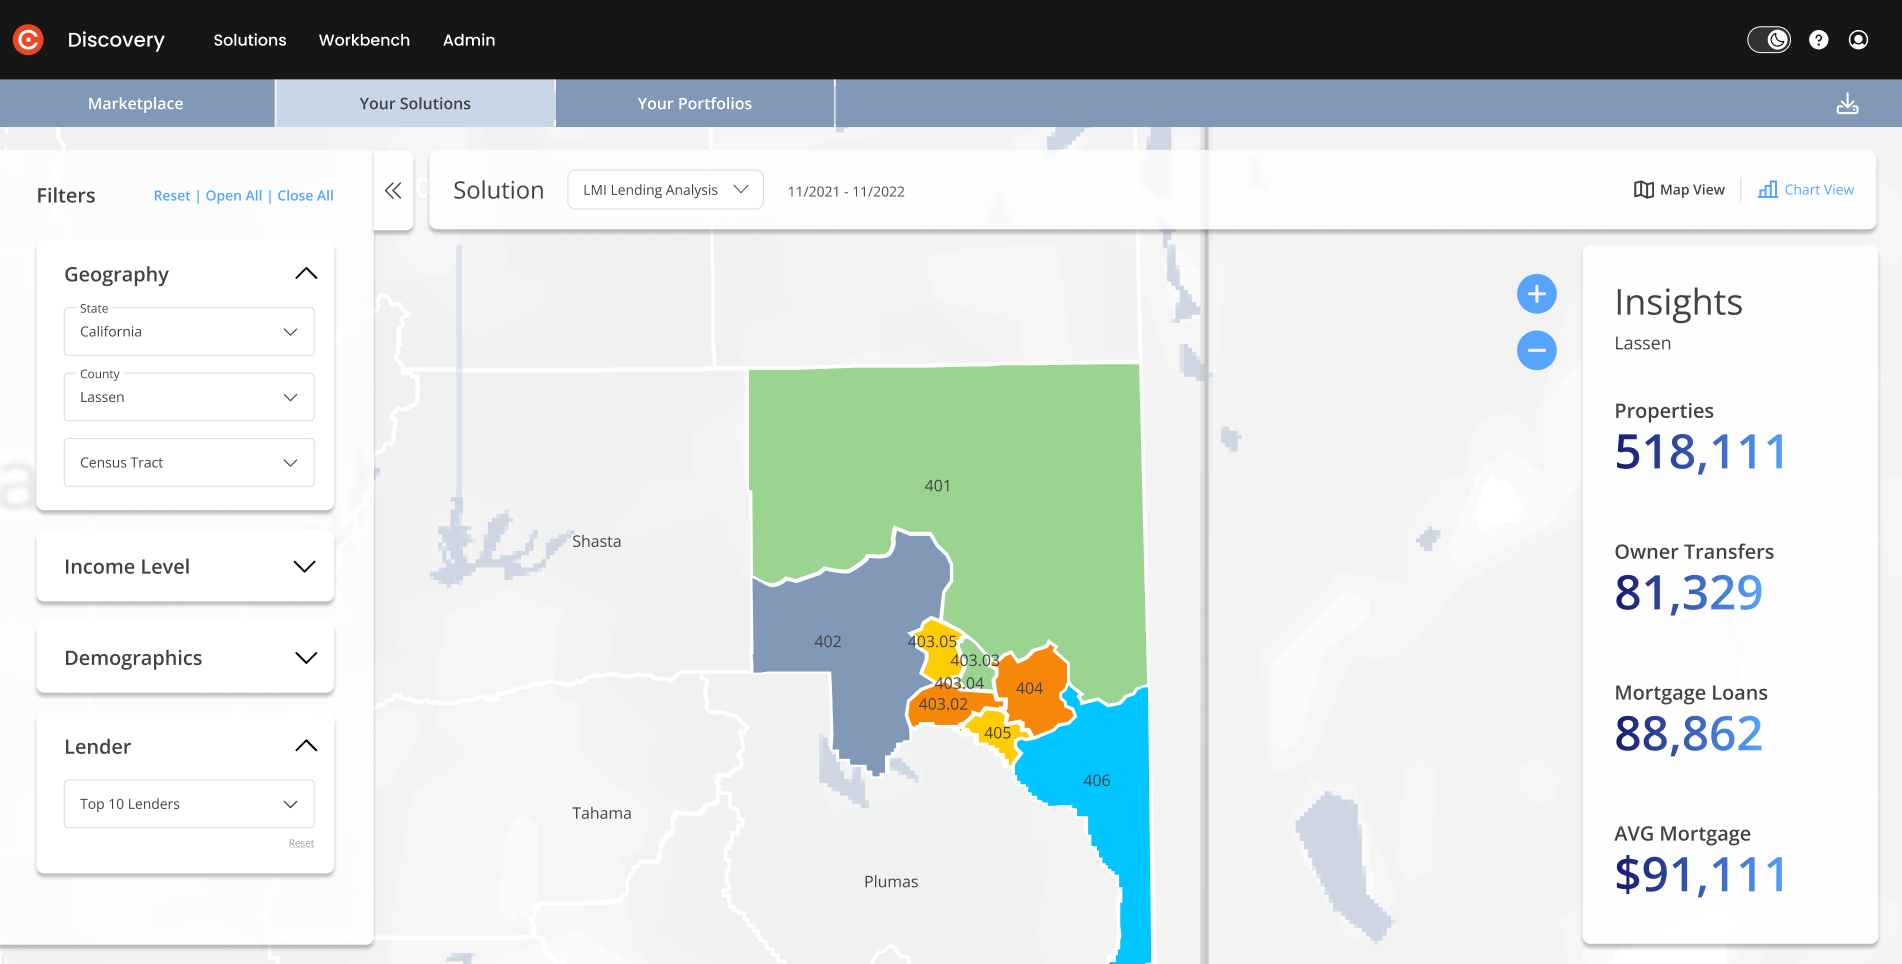
16 | Filter by Lender (Map View) | To filter by Lender, select a name from the dropdown menu in the Lender filter group. |
 | ||
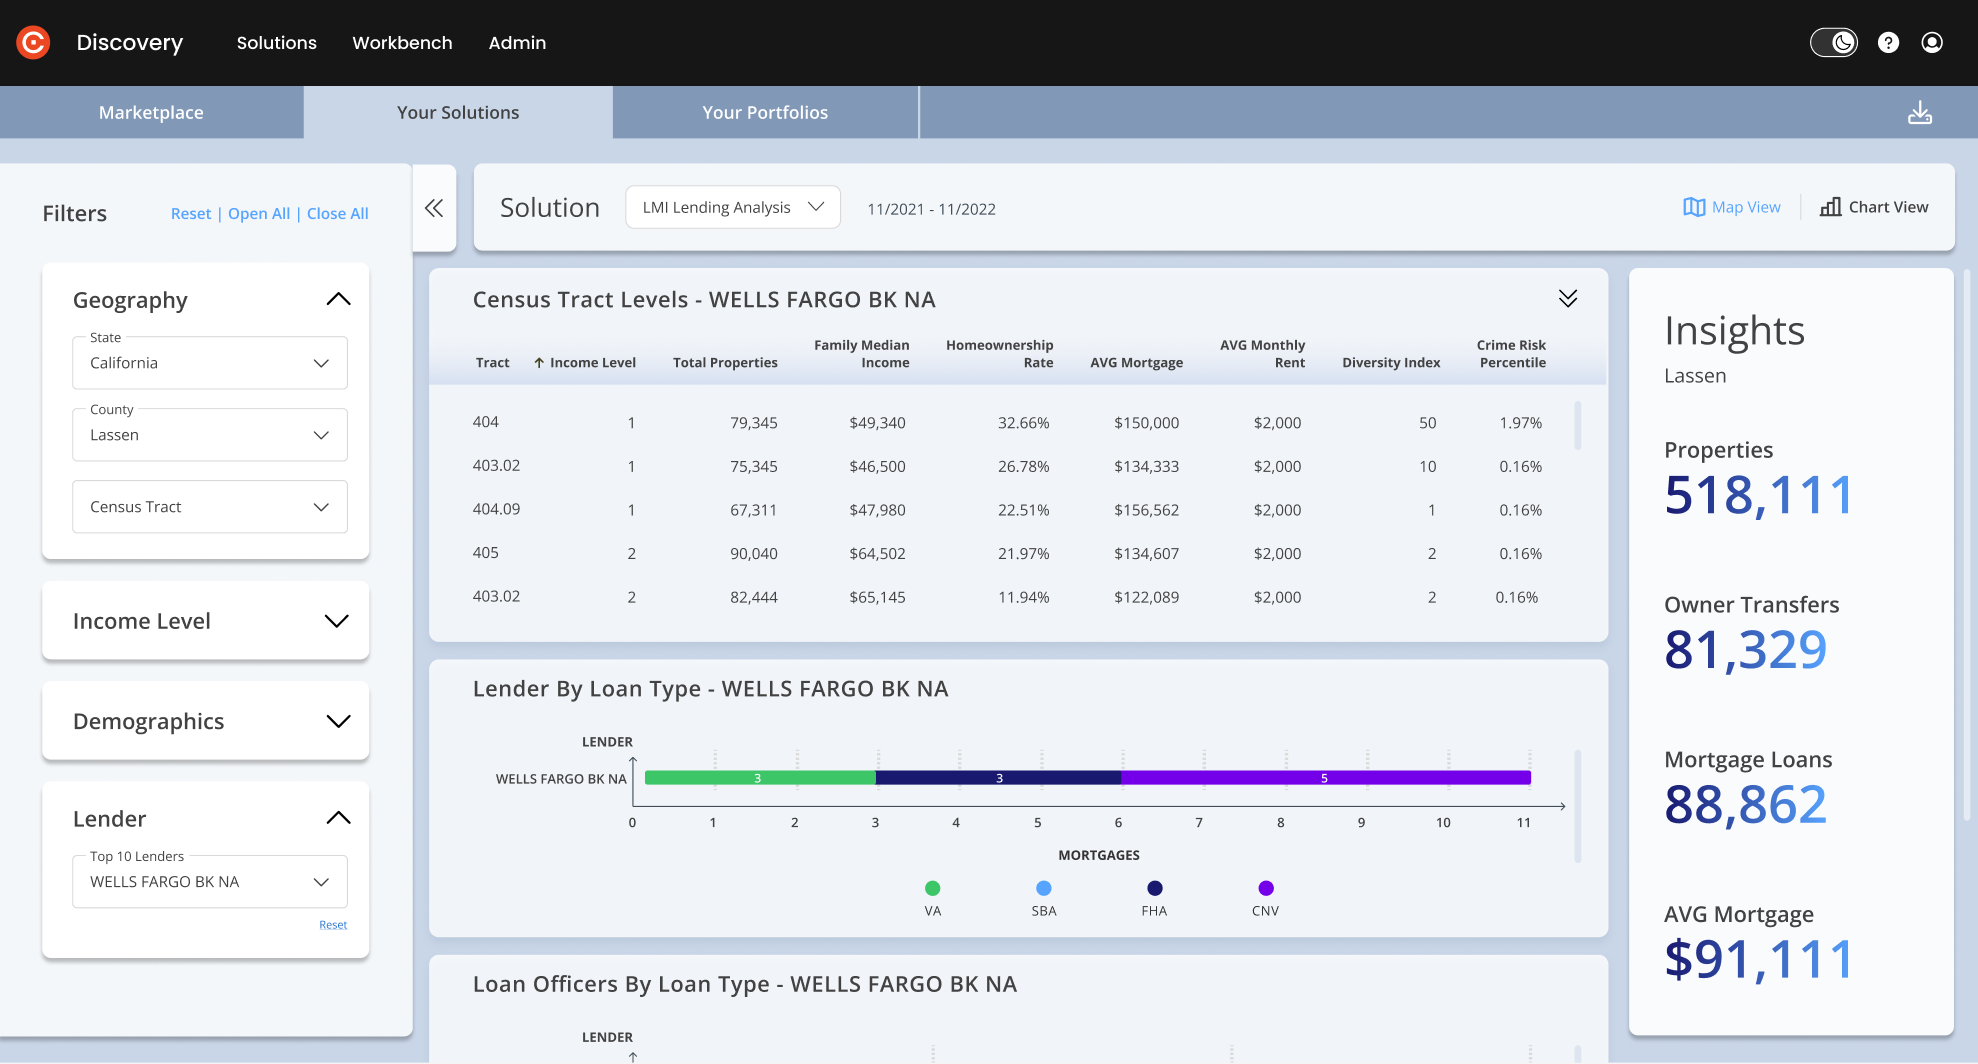
17 | Filter by Lender (Map View) Tooltip Content | The filters will update the tooltip content and will include the list of top 5 Loan Officers for that lender (the same list we can see in the chart view). |
 | ||
18 | Filter by Income Level (Chart View) |
|
 | ||
19 | Filter by Lender (Chart View) | To filter by Lender, select the desired Lender from the dropdown in the filter column. |
 | ||
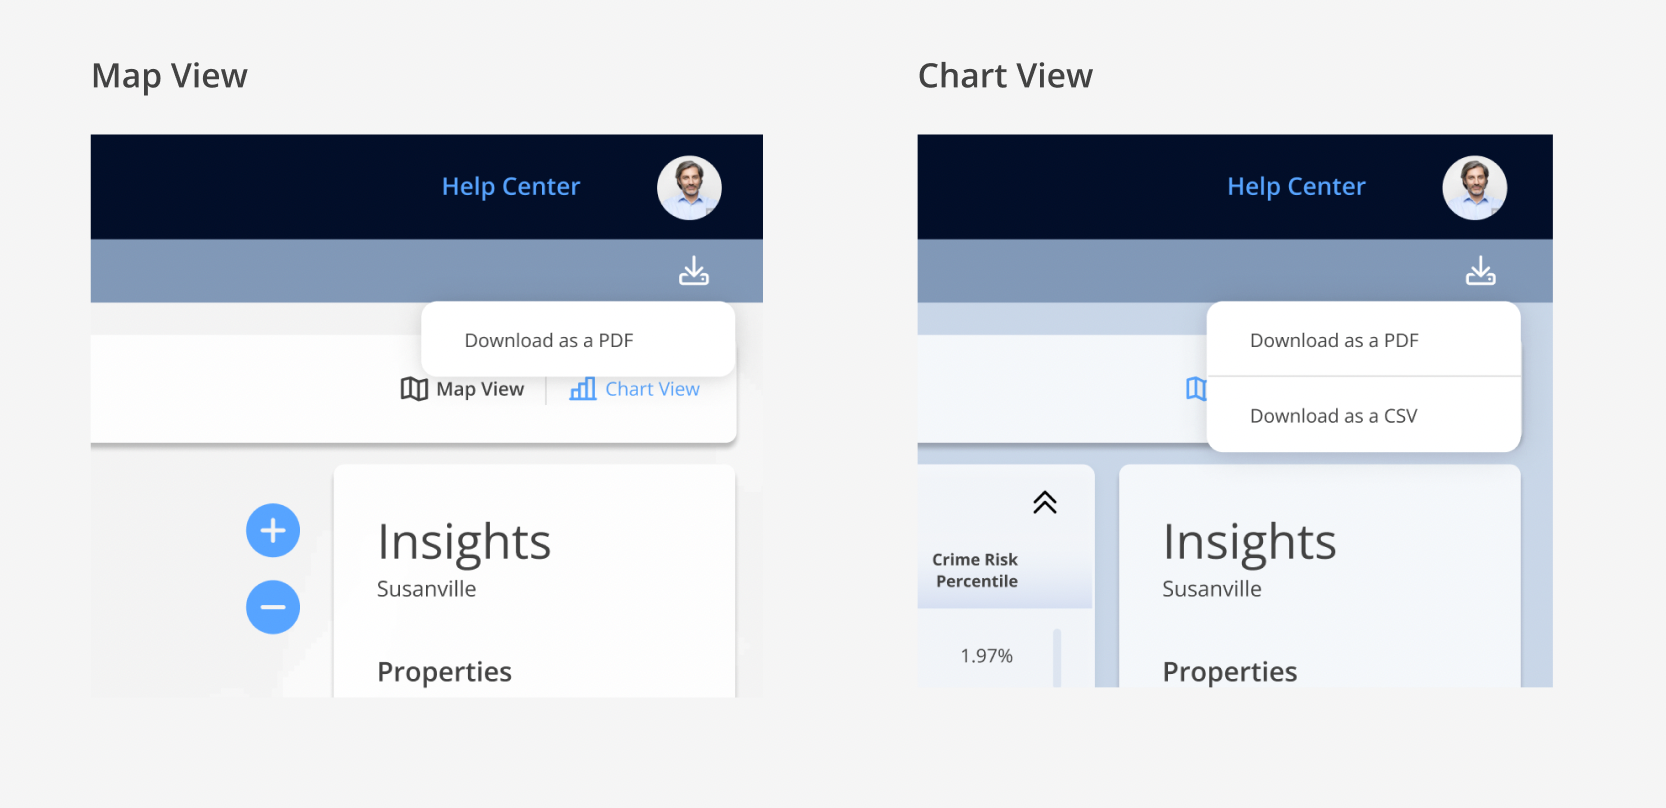
20 | Export | You can download your solution using the export icon on the top right of your screen. The content of the Map View and the Chart View can be exported in separate files.
|
 | ||
Ready to get started? Click here.
